Page 328 - Engineering Plastics Handbook
P. 328

286   Engineering Plastics


                                                                  175
           25
                                  500°F
                                  260°C                           150
          Tensile strength, kpsi  20  420°F                       125  MPa
                            470°F
                            243°C
                      216°C


           15
                300°F
                149°C                                             100
                 Heat up                              Cool down   75
           10
                                   Cure cycle
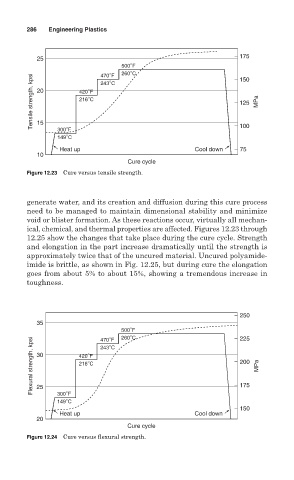
        Figure 12.23 Cure versus tensile strength.


        generate water, and its creation and diffusion during this cure process
        need to be managed to maintain dimensional stability and minimize
        void or blister formation. As these reactions occur, virtually all mechan-
        ical, chemical, and thermal properties are affected. Figures 12.23 through
        12.25 show the changes that take place during the cure cycle. Strength
        and elongation in the part increase dramatically until the strength is
        approximately twice that of the uncured material. Uncured polyamide-
        imide is brittle, as shown in Fig. 12.25, but during cure the elongation
        goes from about 5% to about 15%, showing a tremendous increase in
        toughness.


                                                                  250
           35
                                  500°F                           225
                                  260°C
          Flexural strength, kpsi  30  420°F                      200  MPa
                            470°F
                            243°C
                      216°C


           25
                300°F
                149°C                                             175
                                                                  150
                 Heat up                             Cool down
           20
                                   Cure cycle
        Figure 12.24 Cure versus flexural strength.
   323   324   325   326   327   328   329   330   331   332   333