
Page 157 - Enhanced Oil Recovery in Shale and Tight Reservoirs
P. 157
Gas flooding compared with huff-n-puff gas injection 141
25%
20%
Oil recovery factor 15%
10%
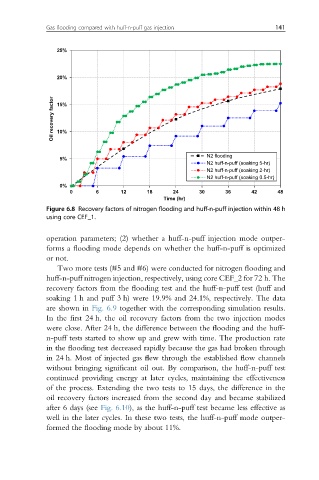
N2 flooding
5%
N2 huff-n-puff (soaking 5-hr)
N2 huff-n-puff (soaking 2-hr)
N2 huff-n-puff (soaking 0.5-hr)
0%
0 6 12 18 24 30 36 42 48
Time (hr)
Figure 6.8 Recovery factors of nitrogen flooding and huff-n-puff injection within 48 h
using core CEF_1.
operation parameters; (2) whether a huff-n-puff injection mode outper-
forms a flooding mode depends on whether the huff-n-puff is optimized
or not.
Two more tests (#5 and #6) were conducted for nitrogen flooding and
huff-n-puff nitrogen injection, respectively, using core CEF_2 for 72 h. The
recovery factors from the flooding test and the huff-n-puff test (huff and
soaking 1 h and puff 3 h) were 19.9% and 24.1%, respectively. The data
are shown in Fig. 6.9 together with the corresponding simulation results.
In the first 24 h, the oil recovery factors from the two injection modes
were close. After 24 h, the difference between the flooding and the huff-
n-puff tests started to show up and grew with time. The production rate
in the flooding test decreased rapidly because the gas had broken through
in 24 h. Most of injected gas flew through the established flow channels
without bringing significant oil out. By comparison, the huff-n-puff test
continued providing energy at later cycles, maintaining the effectiveness
of the process. Extending the two tests to 15 days, the difference in the
oil recovery factors increased from the second day and became stabilized
after 6 days (see Fig. 6.10), as the huff-n-puff test became less effective as
well in the later cycles. In these two tests, the huff-n-puff mode outper-
formed the flooding mode by about 11%.