
Page 154 - Enhanced Oil Recovery in Shale and Tight Reservoirs
P. 154
138 Enhanced Oil Recovery in Shale and Tight Reservoirs
0.06. The injection (huff) pressure is 7000 psi, and the production (puff)
pressure is 2500 psi above the bubble point pressure of 2398 psi. The puff
time and huff time are 200 days.
A black oil simulator, IMEX, developed by Computer Modeling Group
(CMM) is used. The miscibility model uses the Todd and Longstaff (1972)
mixing parameter u. u determines the degree of mixing between the
miscible fluids within a grid block. u ¼ 0 means immiscible displacement,
and u ¼ 1 complete mixing.
Using the above described model, both the flooding mode and the huff-
n-puff mode are simulated. The oil recovery factor after 10 years of primary
depletion is 5.75% which is representative to the typical field performance.
The incremental oil recovery factors over the primary depletion after 20 years
of the flooding and huff-n-puff injection are 2.59% and 16.69%, respectively.
Thus, the huff-n-puff gas injection outperforms the gas flooding. If a net
present value is used, the huff-n-puff performance is even better than the
flooding performance, as the pressure built up near the injector needs a
long time to transport to the producer to enhance oil production in the flood-
ing mode, whereas oil will be produced immediately after the first huff period
in the huff-n-puff mode. The details are presented as follows.
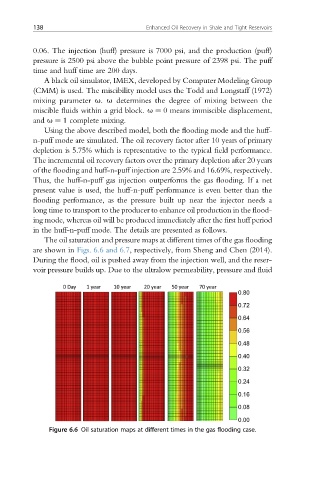
The oil saturation and pressure maps at different times of the gas flooding
are shown in Figs. 6.6 and 6.7, respectively, from Sheng and Chen (2014).
During the flood, oil is pushed away from the injection well, and the reser-
voir pressure builds up. Due to the ultralow permeability, pressure and fluid
Figure 6.6 Oil saturation maps at different times in the gas flooding case.