
Page 151 - Enhanced Oil Recovery in Shale and Tight Reservoirs
P. 151
Gas flooding compared with huff-n-puff gas injection 135
5,000 psi 4,000 psi 3,000 psi
35%
30%
25%
Recovery factor, % 15%
20%
10%
5%
0%
0 4 8 12 16 20 24
Flooding time, hours
Figure 6.2 Oil recovery factors at different flooding pressures.
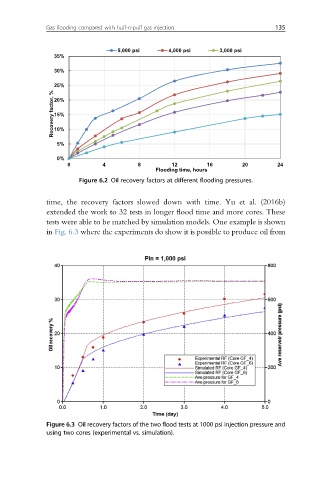
time, the recovery factors slowed down with time. Yu et al. (2016b)
extended the work to 32 tests in longer flood time and more cores. These
tests were able to be matched by simulation models. One example is shown
in Fig. 6.3 where the experiments do show it is possible to produce oil from
Figure 6.3 Oil recovery factors of the two flood tests at 1000 psi injection pressure and
using two cores (experimental vs. simulation).