
Page 155 - Enhanced Oil Recovery in Shale and Tight Reservoirs
P. 155
Gas flooding compared with huff-n-puff gas injection 139
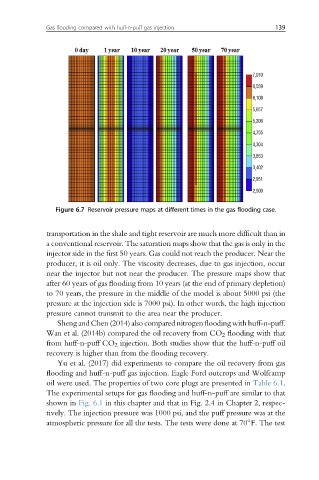
Figure 6.7 Reservoir pressure maps at different times in the gas flooding case.
transportation in the shale and tight reservoir are much more difficult than in
a conventional reservoir. The saturation maps show that the gas is only in the
injector side in the first 50 years. Gas could not reach the producer. Near the
producer, it is oil only. The viscosity decreases, due to gas injection, occur
near the injector but not near the producer. The pressure maps show that
after 60 years of gas flooding from 10 years (at the end of primary depletion)
to 70 years, the pressure in the middle of the model is about 5000 psi (the
pressure at the injection side is 7000 psi). In other words, the high injection
pressure cannot transmit to the area near the producer.
Sheng and Chen (2014) also compared nitrogen flooding with huff-n-puff.
Wan et al. (2014b) compared the oil recovery from CO 2 flooding with that
from huff-n-puff CO 2 injection. Both studies show that the huff-n-puff oil
recovery is higher than from the flooding recovery.
Yu et al. (2017) did experiments to compare the oil recovery from gas
flooding and huff-n-puff gas injection. Eagle Ford outcrops and Wolfcamp
oil were used. The properties of two core plugs are presented in Table 6.1.
The experimental setups for gas flooding and huff-n-puff are similar to that
shown in Fig. 6.1 in this chapter and that in Fig. 2.4 in Chapter 2, respec-
tively. The injection pressure was 1000 psi, and the puff pressure was at the
atmospheric pressure for all the tests. The tests were done at 70 F. The test