
Page 150 - Enhanced Oil Recovery in Shale and Tight Reservoirs
P. 150
134 Enhanced Oil Recovery in Shale and Tight Reservoirs
permeabilities may be calculated if different methods are used). The oil was a
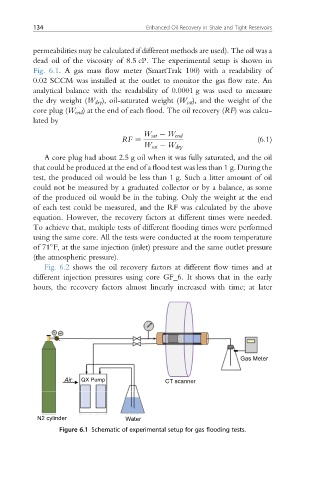
dead oil of the viscosity of 8.5 cP. The experimental setup is shown in
Fig. 6.1. A gas mass flow meter (SmartTrak 100) with a readability of
0.02 SCCM was installed at the outlet to monitor the gas flow rate. An
analytical balance with the readability of 0.0001 g was used to measure
the dry weight (W dry ), oil-saturated weight (W sat ), and the weight of the
core plug (W end ) at the end of each flood. The oil recovery (RF) was calcu-
lated by
W sat W end
RF ¼ (6.1)
W sat W dry
A core plug had about 2.5 g oil when it was fully saturated, and the oil
that could be produced at the end of a flood test was less than 1 g. During the
test, the produced oil would be less than 1 g. Such a litter amount of oil
could not be measured by a graduated collector or by a balance, as some
of the produced oil would be in the tubing. Only the weight at the end
of each test could be measured, and the RF was calculated by the above
equation. However, the recovery factors at different times were needed.
To achieve that, multiple tests of different flooding times were performed
using the same core. All the tests were conducted at the room temperature
of 71 F, at the same injection (inlet) pressure and the same outlet pressure
(the atmospheric pressure).
Fig. 6.2 shows the oil recovery factors at different flow times and at
different injection pressures using core GF_6. It shows that in the early
hours, the recovery factors almost linearly increased with time; at later
Gas Meter
Air QX Pump CT scanner
N2 cylinder Water
Figure 6.1 Schematic of experimental setup for gas flooding tests.