
Page 178 - Enhanced Oil Recovery in Shale and Tight Reservoirs
P. 178
162 Enhanced Oil Recovery in Shale and Tight Reservoirs
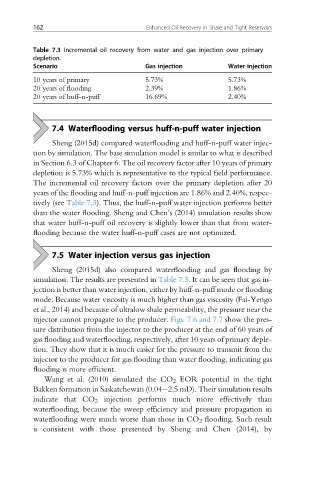
Table 7.3 Incremental oil recovery from water and gas injection over primary
depletion.
Scenario Gas injection Water injection
10 years of primary 5.73% 5.73%
20 years of flooding 2.39% 1.86%
20 years of huff-n-puff 16.69% 2.40%
7.4 Waterflooding versus huff-n-puff water injection
Sheng (2015d) compared waterflooding and huff-n-puff water injec-
tion by simulation. The base simulation model is similar to what is described
in Section 6.3 of Chapter 6. The oil recovery factor after 10 years of primary
depletion is 5.73% which is representative to the typical field performance.
The incremental oil recovery factors over the primary depletion after 20
years of the flooding and huff-n-puff injection are 1.86% and 2.40%, respec-
tively (see Table 7.3). Thus, the huff-n-puff water injection performs better
than the water flooding. Sheng and Chen’s (2014) simulation results show
that water huff-n-puff oil recovery is slightly lower than that from water-
flooding because the water huff-n-puff cases are not optimized.
7.5 Water injection versus gas injection
Sheng (2015d) also compared waterflooding and gas flooding by
simulation. The results are presented in Table 7.3. It can be seen that gas in-
jection is better than water injection, either by huff-n-puff mode or flooding
mode. Because water viscosity is much higher than gas viscosity (Fai-Yengo
et al., 2014) and because of ultralow shale permeability, the pressure near the
injector cannot propagate to the producer. Figs. 7.6 and 7.7 show the pres-
sure distribution from the injector to the producer at the end of 60 years of
gas flooding and waterflooding, respectively, after 10 years of primary deple-
tion. They show that it is much easier for the pressure to transmit from the
injector to the producer for gas flooding than water flooding, indicating gas
flooding is more efficient.
Wang et al. (2010) simulated the CO 2 EOR potential in the tight
Bakken formation in Saskatchewan (0.04e2.5 mD). Their simulation results
indicate that CO 2 injection performs much more effectively than
waterflooding, because the sweep efficiency and pressure propagation in
waterflooding were much worse than those in CO 2 flooding. Such result
is consistent with those presented by Sheng and Chen (2014), by