
Page 338 - Enhanced Oil Recovery in Shale and Tight Reservoirs
P. 338
Forced imbibition 311
Table 11.1 Grid parameters of the simulation model.
Parameter Matrix Fracture
Number of grids 31 11 3
Grid size in the X 0.02778 0.003281
direction, ft
Porosity 0.298 1
Permeability, mD 34 2000
0.5 wt.% PetroStep S-2, 2 wt.% secondary butanol as cosolvent, 1 wt.%
sodium metaborate, and 3.8 wt.% NaCl. The injection rate in the experi-
3
ment was 0.002 ft /day. The pressure gradient was 0.8 psi/ft. For more
detailed experimental description, see Najafabadi et al. (2008).
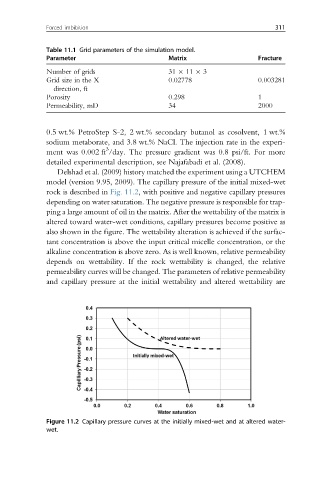
Delshad et al. (2009) history matched the experiment using a UTCHEM
model (version 9.95, 2009). The capillary pressure of the initial mixed-wet
rock is described in Fig. 11.2, with positive and negative capillary pressures
depending on water saturation. The negative pressure is responsible for trap-
ping a large amount of oil in the matrix. After the wettability of the matrix is
altered toward water-wet conditions, capillary pressures become positive as
also shown in the figure. The wettability alteration is achieved if the surfac-
tant concentration is above the input critical micelle concentration, or the
alkaline concentration is above zero. As is well known, relative permeability
depends on wettability. If the rock wettability is changed, the relative
permeability curves will be changed. The parameters of relative permeability
and capillary pressure at the initial wettability and altered wettability are
Figure 11.2 Capillary pressure curves at the initially mixed-wet and at altered water-
wet.