
Page 339 - Enhanced Oil Recovery in Shale and Tight Reservoirs
P. 339
312 Enhanced Oil Recovery in Shale and Tight Reservoirs
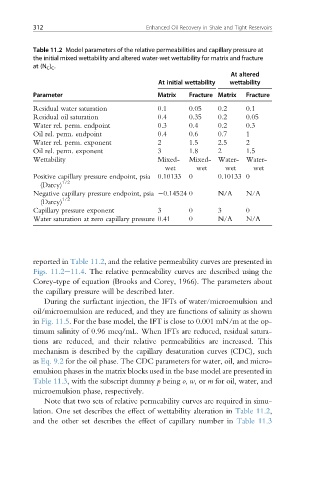
Table 11.2 Model parameters of the relative permeabilities and capillary pressure at
the initial mixed wettability and altered water-wet wettability for matrix and fracture
at (N C ) C .
At altered
At initial wettability wettability
Parameter Matrix Fracture Matrix Fracture
Residual water saturation 0.1 0.05 0.2 0.1
Residual oil saturation 0.4 0.35 0.2 0.05
Water rel. perm. endpoint 0.3 0.4 0.2 0.3
Oil rel. perm. endpoint 0.4 0.6 0.7 1
Water rel. perm. exponent 2 1.5 2.5 2
Oil rel. perm. exponent 3 1.8 2 1.5
Wettability Mixed- Mixed- Water- Water-
wet wet wet wet
Positive capillary pressure endpoint, psia 0.10133 0 0.10133 0
(Darcy) 1/2
Negative capillary pressure endpoint, psia 0.14524 0 N/A N/A
(Darcy) 1/2
Capillary pressure exponent 3 0 3 0
Water saturation at zero capillary pressure 0.41 0 N/A N/A
reported in Table 11.2, and the relative permeability curves are presented in
Figs. 11.2e11.4. The relative permeability curves are described using the
Corey-type of equation (Brooks and Corey, 1966). The parameters about
the capillary pressure will be described later.
During the surfactant injection, the IFTs of water/microemulsion and
oil/microemulsion are reduced, and they are functions of salinity as shown
in Fig. 11.5. For the base model, the IFT is close to 0.001 mN/m at the op-
timum salinity of 0.96 meq/mL. When IFTs are reduced, residual satura-
tions are reduced, and their relative permeabilities are increased. This
mechanism is described by the capillary desaturation curves (CDC), such
as Eq. 9.2 for the oil phase. The CDC parameters for water, oil, and micro-
emulsion phases in the matrix blocks used in the base model are presented in
Table 11.3, with the subscript dummy p being o, w,or m for oil, water, and
microemulsion phase, respectively.
Note that two sets of relative permeability curves are required in simu-
lation. One set describes the effect of wettability alteration in Table 11.2,
and the other set describes the effect of capillary number in Table 11.3