
Page 342 - Enhanced Oil Recovery in Shale and Tight Reservoirs
P. 342
Forced imbibition 315
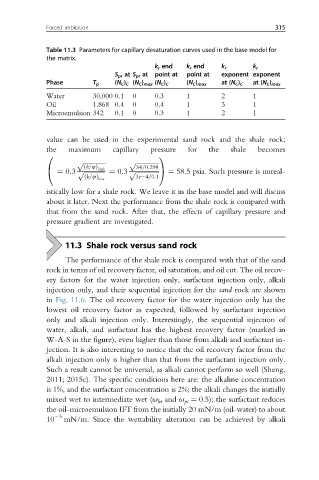
Table 11.3 Parameters for capillary desaturation curves used in the base model for
the matrix.
k r end k r end k r k r
S pr at S pr at point at point at exponent exponent
Phase T p (N C ) C (N C ) max (N C ) C (N C ) max at (N C ) C at (N C ) max
Water 30,000 0.1 0 0.3 1 2 1
Oil 1,868 0.4 0 0.4 1 3 1
Microemulsion 342 0.1 0 0.3 1 2 1
value can be used in the experimental sand rock and the shale rock;
the maximum capillary pressure for the shale becomes
0 1
p ffiffiffiffiffiffiffiffiffiffiffiffiffi p ffiffiffiffiffiffiffiffiffiffiffiffiffiffi
ðk=4Þ high 34=0:298
p
@ ¼ 0:3 p ffiffiffiffiffiffiffiffiffiffiffiffiffi ¼ 0:3 ffiffiffiffiffiffiffiffiffiffiffiffiffiffiA ¼ 58.5 psia. Such pressure is unreal-
ðk=4Þ low 3e 4=0:1
istically low for a shale rock. We leave it in the base model and will discuss
about it later. Next the performance from the shale rock is compared with
that from the sand rock. After that, the effects of capillary pressure and
pressure gradient are investigated.
11.3 Shale rock versus sand rock
The performance of the shale rock is compared with that of the sand
rock in terms of oil recovery factor, oil saturation, and oil cut. The oil recov-
ery factors for the water injection only, surfactant injection only, alkali
injection only, and their sequential injection for the sand rock are shown
in Fig. 11.6. The oil recovery factor for the water injection only has the
lowest oil recovery factor as expected, followed by surfactant injection
only and alkali injection only. Interestingly, the sequential injection of
water, alkali, and surfactant has the highest recovery factor (marked in
W-A-S in the figure), even higher than those from alkali and surfactant in-
jection. It is also interesting to notice that the oil recovery factor from the
alkali injection only is higher than that from the surfactant injection only.
Such a result cannot be universal, as alkali cannot perform so well (Sheng,
2011; 2015c). The specific conditions here are: the alkaline concentration
is 1%, and the surfactant concentration is 2%; the alkali changes the initially
mixed wet to intermediate wet (u kr and u pc ¼ 0.5); the surfactant reduces
the oil-microemulsion IFT from the initially 20 mN/m (oil-water) to about
10 3 mN/m. Since the wettability alteration can be achieved by alkali