
Page 347 - Enhanced Oil Recovery in Shale and Tight Reservoirs
P. 347
320 Enhanced Oil Recovery in Shale and Tight Reservoirs
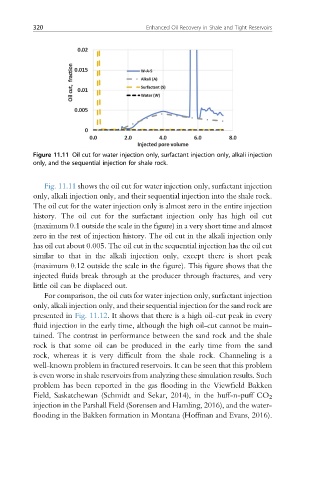
Figure 11.11 Oil cut for water injection only, surfactant injection only, alkali injection
only, and the sequential injection for shale rock.
Fig. 11.11 shows the oil cut for water injection only, surfactant injection
only, alkali injection only, and their sequential injection into the shale rock.
The oil cut for the water injection only is almost zero in the entire injection
history. The oil cut for the surfactant injection only has high oil cut
(maximum 0.1 outside the scale in the figure) in a very short time and almost
zero in the rest of injection history. The oil cut in the alkali injection only
has oil cut about 0.005. The oil cut in the sequential injection has the oil cut
similar to that in the alkali injection only, except there is short peak
(maximum 0.12 outside the scale in the figure). This figure shows that the
injected fluids break through at the producer through fractures, and very
little oil can be displaced out.
For comparison, the oil cuts for water injection only, surfactant injection
only, alkali injection only, and their sequential injection for the sand rock are
presented in Fig. 11.12. It shows that there is a high oil-cut peak in every
fluid injection in the early time, although the high oil-cut cannot be main-
tained. The contrast in performance between the sand rock and the shale
rock is that some oil can be produced in the early time from the sand
rock, whereas it is very difficult from the shale rock. Channeling is a
well-known problem in fractured reservoirs. It can be seen that this problem
is even worse in shale reservoirs from analyzing these simulation results. Such
problem has been reported in the gas flooding in the Viewfield Bakken
Field, Saskatchewan (Schmidt and Sekar, 2014), in the huff-n-puff CO 2
injection in the Parshall Field (Sorensen and Hamling, 2016), and the water-
flooding in the Bakken formation in Montana (Hoffman and Evans, 2016).