
Page 348 - Enhanced Oil Recovery in Shale and Tight Reservoirs
P. 348
Forced imbibition 321
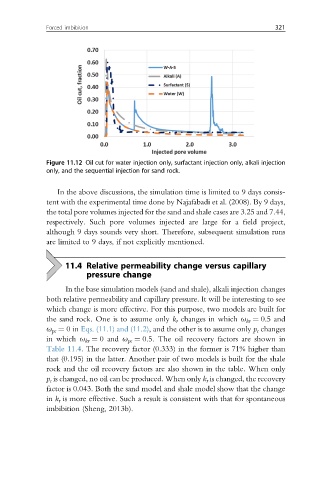
Figure 11.12 Oil cut for water injection only, surfactant injection only, alkali injection
only, and the sequential injection for sand rock.
In the above discussions, the simulation time is limited to 9 days consis-
tent with the experimental time done by Najafabadi et al. (2008). By 9 days,
the total pore volumes injected for the sand and shale cases are 3.25 and 7.44,
respectively. Such pore volumes injected are large for a field project,
although 9 days sounds very short. Therefore, subsequent simulation runs
are limited to 9 days, if not explicitly mentioned.
11.4 Relative permeability change versus capillary
pressure change
In the base simulation models (sand and shale), alkali injection changes
both relative permeability and capillary pressure. It will be interesting to see
which change is more effective. For this purpose, two models are built for
the sand rock. One is to assume only k r changes in which u kr ¼ 0.5 and
u pc ¼ 0in Eqs. (11.1) and (11.2), and the other is to assume only p c changes
in which u kr ¼ 0 and u pc ¼ 0.5. The oil recovery factors are shown in
Table 11.4. The recovery factor (0.333) in the former is 71% higher than
that (0.195) in the latter. Another pair of two models is built for the shale
rock and the oil recovery factors are also shown in the table. When only
p c is changed, no oil can be produced. When only k r is changed, the recovery
factor is 0.043. Both the sand model and shale model show that the change
in k r is more effective. Such a result is consistent with that for spontaneous
imbibition (Sheng, 2013b).