
Page 349 - Enhanced Oil Recovery in Shale and Tight Reservoirs
P. 349
322 Enhanced Oil Recovery in Shale and Tight Reservoirs
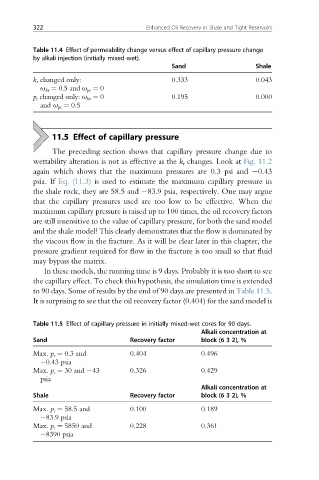
Table 11.4 Effect of permeability change versus effect of capillary pressure change
by alkali injection (initially mixed-wet).
Sand Shale
k r changed only: 0.333 0.043
u kr ¼ 0.5 and u pc ¼ 0
p c changed only: u kr ¼ 0 0.195 0.000
and u pc ¼ 0.5
11.5 Effect of capillary pressure
The preceding section shows that capillary pressure change due to
wettability alteration is not as effective as the k r changes. Look at Fig. 11.2
again which shows that the maximum pressures are 0.3 psi and 0.43
psia. If Eq. (11.3) is used to estimate the maximum capillary pressure in
the shale rock, they are 58.5 and 83.9 psia, respectively. One may argue
that the capillary pressures used are too low to be effective. When the
maximum capillary pressure is raised up to 100 times, the oil recovery factors
are still insensitive to the value of capillary pressure, for both the sand model
and the shale model! This clearly demonstrates that the flow is dominated by
the viscous flow in the fracture. As it will be clear later in this chapter, the
pressure gradient required for flow in the fracture is too small so that fluid
may bypass the matrix.
In these models, the running time is 9 days. Probably it is too short to see
the capillary effect. To check this hypothesis, the simulation time is extended
to 90 days. Some of results by the end of 90 days are presented in Table 11.5.
It is surprising to see that the oil recovery factor (0.404) for the sand model is
Table 11.5 Effect of capillary pressure in initially mixed-wet cores for 90 days.
Alkali concentration at
Sand Recovery factor block (6 3 2), %
Max. p c ¼ 0.3 and 0.404 0.496
0.43 psia
Max. p c ¼ 30 and 43 0.326 0.429
psia
Alkali concentration at
Shale Recovery factor block (6 3 2), %
Max. p c ¼ 58.5 and 0.100 0.189
83.9 psia
Max. p c ¼ 5850 and 0.228 0.361
8390 psia