
Page 350 - Enhanced Oil Recovery in Shale and Tight Reservoirs
P. 350
Forced imbibition 323
higher at the lower capillary pressure than that (0.326) at the higher capillary
pressure. But the oil recovery factors for the shale model do not show such
result. This result demonstrates that the capillary drive in tight formation is
more important.
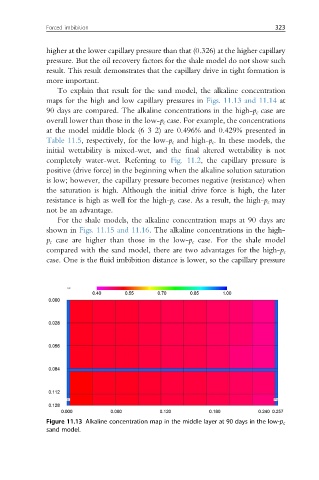
To explain that result for the sand model, the alkaline concentration
maps for the high and low capillary pressures in Figs. 11.13 and 11.14 at
90 days are compared. The alkaline concentrations in the high-p c case are
overall lower than those in the low-p c case. For example, the concentrations
at the model middle block (6 3 2) are 0.496% and 0.429% presented in
Table 11.5, respectively, for the low-p c and high-p c . In these models, the
initial wettability is mixed-wet, and the final altered wettability is not
completely water-wet. Referring to Fig. 11.2, the capillary pressure is
positive (drive force) in the beginning when the alkaline solution saturation
is low; however, the capillary pressure becomes negative (resistance) when
the saturation is high. Although the initial drive force is high, the later
resistance is high as well for the high-p c case. As a result, the high-p c may
not be an advantage.
For the shale models, the alkaline concentration maps at 90 days are
shown in Figs. 11.15 and 11.16. The alkaline concentrations in the high-
p c case are higher than those in the low-p c case. For the shale model
compared with the sand model, there are two advantages for the high-p c
case. One is the fluid imbibition distance is lower, so the capillary pressure
Figure 11.13 Alkaline concentration map in the middle layer at 90 days in the low-p c
sand model.