
Page 353 - Enhanced Oil Recovery in Shale and Tight Reservoirs
P. 353
326 Enhanced Oil Recovery in Shale and Tight Reservoirs
From the sand models, when the initially wettability is changed
from mixed-wet to oil wet, the oil recovery factor is changed from 0.195
(in Table 11.4) to 0.067 (in Table 11.6). This indicates that initial wettability
is very important, which is consistent with Bourbiaux and Kalaydjian (1990)
experimental data for spontaneous imbibition.
These models assume the magnitudes of maximum positive and negative
p c are increased at the same proportion. Now keep the initial oil-wet capil-
lary pressure unchanged and the capillary pressure endpoint parameter
0.5
is 1.452 psia (Darcy) . After wettability alteration, the parameter is
changed to 0.1033, 1.033, and 10.33 psia (Darcy) 0.5 (the cases presented
in bold in Table 11.6). For the sand models, the changes in oil recovery
factors are not noticeable (close to 0.025). For the shale models, the oil
recovery factors remain zero. These results confirm the conclusion that
the oil recovery is insensitive to the absolute value of altered capillary pressure,
if the rock is initially oil-wet. This is because when the rock is oil-wet, it is
very slow for a chemical to diffuse into the rock to alter its wettability,
then the subsequent high capillary pressure of water-wet nature cannot
play its role. The p c value is proportional to IFT. If the p c value is not impor-
tant, then the IFT is not important during wettability alteration from
oil-wetness.
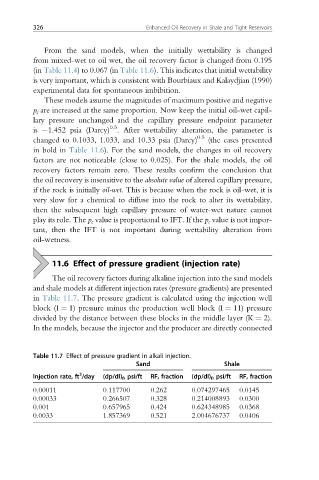
11.6 Effect of pressure gradient (injection rate)
The oil recovery factors during alkaline injection into the sand models
and shale models at different injection rates (pressure gradients) are presented
in Table 11.7. The pressure gradient is calculated using the injection well
block (I ¼ 1) pressure minus the production well block (I ¼ 11) pressure
divided by the distance between these blocks in the middle layer (K ¼ 2).
In the models, because the injector and the producer are directly connected
Table 11.7 Effect of pressure gradient in alkali injection.
Sand Shale
3
Injection rate, ft /day (dp/dl) f , psi/ft RF, fraction (dp/dl) f , psi/ft RF, fraction
0.00011 0.117700 0.262 0.074297465 0.0145
0.00033 0.266507 0.328 0.214008893 0.0300
0.001 0.657965 0.424 0.624348985 0.0368
0.0033 1.857369 0.521 2.004676737 0.0406