
Page 373 - Enhanced Oil Recovery in Shale and Tight Reservoirs
P. 373
Fracturing fluid flow back 345
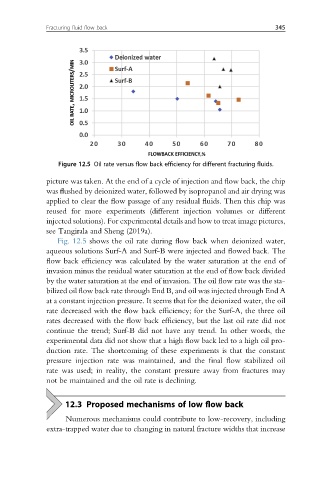
Figure 12.5 Oil rate versus flow back efficiency for different fracturing fluids.
picture was taken. At the end of a cycle of injection and flow back, the chip
was flushed by deionized water, followed by isopropanol and air drying was
applied to clear the flow passage of any residual fluids. Then this chip was
reused for more experiments (different injection volumes or different
injected solutions). For experimental details and how to treat image pictures,
see Tangirala and Sheng (2019a).
Fig. 12.5 shows the oil rate during flow back when deionized water,
aqueous solutions Surf-A and Surf-B were injected and flowed back. The
flow back efficiency was calculated by the water saturation at the end of
invasion minus the residual water saturation at the end of flow back divided
by the water saturation at the end of invasion. The oil flow rate was the sta-
bilized oil flow back rate through End B, and oil was injected through End A
at a constant injection pressure. It seems that for the deionized water, the oil
rate decreased with the flow back efficiency; for the Surf-A, the three oil
rates decreased with the flow back efficiency, but the last oil rate did not
continue the trend; Surf-B did not have any trend. In other words, the
experimental data did not show that a high flow back led to a high oil pro-
duction rate. The shortcoming of these experiments is that the constant
pressure injection rate was maintained, and the final flow stabilized oil
rate was used; in reality, the constant pressure away from fractures may
not be maintained and the oil rate is declining.
12.3 Proposed mechanisms of low flow back
Numerous mechanisms could contribute to low-recovery, including
extra-trapped water due to changing in natural fracture widths that increase