
Page 370 - Enhanced Oil Recovery in Shale and Tight Reservoirs
P. 370
342 Enhanced Oil Recovery in Shale and Tight Reservoirs
2.5 1800
Muskwa Otter Park Evie
1600
2 1400
Flowback Efficiency % 1.5 1000 Gas recovery (SCf)
1200
800
1
400
0.5 600
200
0 0
well OP-R2
well M-L1
well M-L3
well OP-L1
well E-L1
well E-L3
well OP-L3
well E-R2
well M-R2
well M-R1 well M-R3 well M-L2 well OP-R1 well OP-R3 well OP-L2 well E-R1 well E-R3 well E-L2
Gas recovery after 72 hours Flowback efficiency after 72 hours
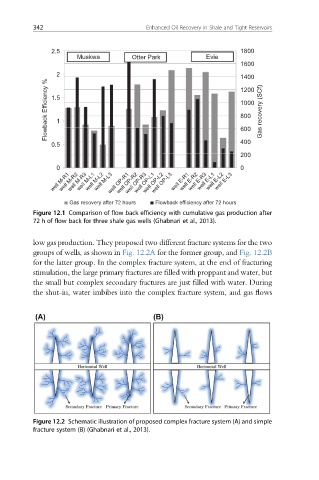
Figure 12.1 Comparison of flow back efficiency with cumulative gas production after
72 h of flow back for three shale gas wells (Ghabnari et al., 2013).
low gas production. They proposed two different fracture systems for the two
groups of wells, as shown in Fig. 12.2A for the former group, and Fig. 12.2B
for the latter group. In the complex fracture system, at the end of fracturing
stimulation, the large primary fractures are filled with proppant and water, but
the small but complex secondary fractures are just filled with water. During
the shut-in, water imbibes into the complex fracture system, and gas flows
Figure 12.2 Schematic illustration of proposed complex fracture system (A) and simple
fracture system (B) (Ghabnari et al., 2013).