
Page 372 - Enhanced Oil Recovery in Shale and Tight Reservoirs
P. 372
344 Enhanced Oil Recovery in Shale and Tight Reservoirs
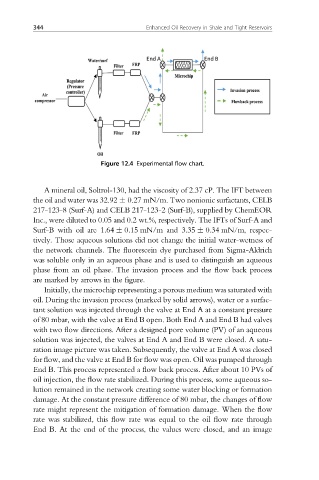
Figure 12.4 Experimental flow chart.
A mineral oil, Soltrol-130, had the viscosity of 2.37 cP. The IFT between
the oil and water was 32.92 0.27 mN/m. Two nonionic surfactants, CELB
217-123-8 (Surf-A) and CELB 217-123-2 (Surf-B), supplied by ChemEOR
Inc., were diluted to 0.05 and 0.2 wt.%, respectively. The IFTs of Surf-A and
Surf-B with oil are 1.64 0.15 mN/m and 3.35 0.34 mN/m, respec-
tively. Those aqueous solutions did not change the initial water-wetness of
the network channels. The fluorescein dye purchased from Sigma-Aldrich
was soluble only in an aqueous phase and is used to distinguish an aqueous
phase from an oil phase. The invasion process and the flow back process
are markedbyarrowsinthe figure.
Initially, the microchip representing a porous medium was saturated with
oil. During the invasion process (marked by solid arrows), water or a surfac-
tant solution was injected through the valve at End A at a constant pressure
of 80 mbar, with the valve at End B open. Both End A and End B had valves
with two flow directions. After a designed pore volume (PV) of an aqueous
solution was injected, the valves at End A and End B were closed. A satu-
ration image picture was taken. Subsequently, the valve at End A was closed
for flow, and the valve at End B for flow was open. Oil was pumped through
End B. This process represented a flow back process. After about 10 PVs of
oil injection, the flow rate stabilized. During this process, some aqueous so-
lution remained in the network creating some water blocking or formation
damage. At the constant pressure difference of 80 mbar, the changes of flow
rate might represent the mitigation of formation damage. When the flow
rate was stabilized, this flow rate was equal to the oil flow rate through
End B. At the end of the process, the values were closed, and an image