
Page 442 - Enhanced Oil Recovery in Shale and Tight Reservoirs
P. 442
410 Enhanced Oil Recovery in Shale and Tight Reservoirs
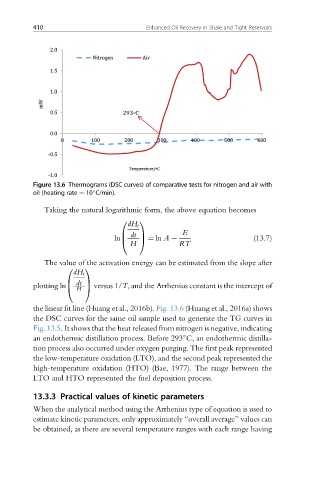
Figure 13.6 Thermograms (DSC curves) of comparative tests for nitrogen and air with
oil (heating rate ¼ 10 C/min).
Taking the natural logarithmic form, the above equation becomes
0 1
dH t
E
(13.7)
B dt C
ln@ A ¼ ln A
H RT
The value of the activation energy can be estimated from the slope after
0 1
dH t
dt
B A versus 1/T, and the Arrhenius constant is the intercept of
C
H
plotting ln@
the linear fit line (Huang et al., 2016b). Fig. 13.6 (Huang et al., 2016a) shows
the DSC curves for the same oil sample used to generate the TG curves in
Fig. 13.5. It shows that the heat released from nitrogen is negative, indicating
an endothermic distillation process. Before 293 C, an endothermic distilla-
tion process also occurred under oxygen purging. The first peak represented
the low-temperature oxidation (LTO), and the second peak represented the
high-temperature oxidation (HTO) (Bae, 1977). The range between the
LTO and HTO represented the fuel deposition process.
13.3.3 Practical values of kinetic parameters
When the analytical method using the Arrhenius type of equation is used to
estimate kinetic parameters, only approximately “overall average” values can
be obtained, as there are several temperature ranges with each range having