
Page 87 - Enhanced Oil Recovery in Shale and Tight Reservoirs
P. 87
74 Enhanced Oil Recovery in Shale and Tight Reservoirs
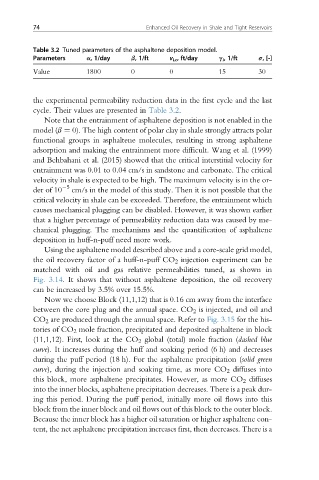
Table 3.2 Tuned parameters of the asphaltene deposition model.
Parameters a, 1/day b, 1/ft v Lc , ft/day g i , 1/ft s, [-]
Value 1800 0 0 15 30
the experimental permeability reduction data in the first cycle and the last
cycle. Their values are presented in Table 3.2.
Note that the entrainment of asphaltene deposition is not enabled in the
model (b ¼ 0). The high content of polar clay in shale strongly attracts polar
functional groups in asphaltene molecules, resulting in strong asphaltene
adsorption and making the entrainment more difficult. Wang et al. (1999)
and Behbahani et al. (2015) showed that the critical interstitial velocity for
entrainment was 0.01 to 0.04 cm/s in sandstone and carbonate. The critical
velocity in shale is expected to be high. The maximum velocity is in the or-
der of 10 5 cm/s in the model of this study. Then it is not possible that the
critical velocity in shale can be exceeded. Therefore, the entrainment which
causes mechanical plugging can be disabled. However, it was shown earlier
that a higher percentage of permeability reduction data was caused by me-
chanical plugging. The mechanisms and the quantification of asphaltene
deposition in huff-n-puff need more work.
Using the asphaltene model described above and a core-scale grid model,
the oil recovery factor of a huff-n-puff CO 2 injection experiment can be
matched with oil and gas relative permeabilities tuned, as shown in
Fig. 3.14. It shows that without asphaltene deposition, the oil recovery
can be increased by 3.5% over 15.5%.
Now we choose Block (11,1,12) that is 0.16 cm away from the interface
between the core plug and the annual space. CO 2 is injected, and oil and
CO 2 are produced through the annual space. Refer to Fig. 3.15 for the his-
tories of CO 2 mole fraction, precipitated and deposited asphaltene in block
(11,1,12). First, look at the CO 2 global (total) mole fraction (dashed blue
curve). It increases during the huff and soaking period (6 h) and decreases
during the puff period (18 h). For the asphaltene precipitation (solid green
curve), during the injection and soaking time, as more CO 2 diffuses into
this block, more asphaltene precipitates. However, as more CO 2 diffuses
into the inner blocks, asphaltene precipitation decreases. There is a peak dur-
ing this period. During the puff period, initially more oil flows into this
block from the inner block and oil flows out of this block to the outer block.
Because the inner block has a higher oil saturation or higher asphaltene con-
tent, the net asphaltene precipitation increases first, then decreases. There is a