
Page 82 - Enhanced Oil Recovery in Shale and Tight Reservoirs
P. 82
Asphaltene precipitation and deposition in a huff-n-puff process 69
like a snowball growth. The complete plugging could happen after a contin-
uous asphaltene adsorption. In shale, clay is a polar component. A higher
adsorption rate would be expected. And nanometer pores may lead to the
snowball growth of asphaltene to plug the pores. It needs to be mentioned
that the Wolfcamp shale oil used in this study was dead oil. Permeability
reduction by asphaltene deposition for live reservoir fluid flooding was
found higher than that for dead oil flooding (Behbahani et al., 2015).
3.3 Deposition mechanisms
In another study, Shen and Sheng (2017b) conducted experiments to
quantify the asphaltene deposition mechanisms during CO 2 huff-n-puff
injection in an Eagle Ford shale core using Wolfcamp shale oil. After six
cycles of CO 2 huff-n-puff were completed, a piece of core of 0.9 cm length
was cut from the core plug using hacksaw for the n-heptane and toluene
reverse flooding tests. These tests were used to measure permeability. The
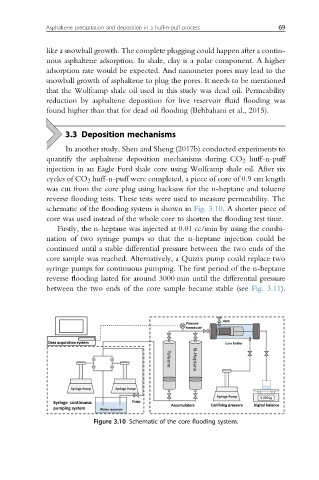
schematic of the flooding system is shown in Fig. 3.10. A shorter piece of
core was used instead of the whole core to shorten the flooding test time.
Firstly, the n-heptane was injected at 0.01 cc/min by using the combi-
nation of two syringe pumps so that the n-heptane injection could be
continued until a stable differential pressure between the two ends of the
core sample was reached. Alternatively, a Quizix pump could replace two
syringe pumps for continuous pumping. The first period of the n-heptane
reverse flooding lasted for around 3000 min until the differential pressure
between the two ends of the core sample became stable (see Fig. 3.11).
Figure 3.10 Schematic of the core flooding system.