
Page 78 - Enhanced Oil Recovery in Shale and Tight Reservoirs
P. 78
Asphaltene precipitation and deposition in a huff-n-puff process 65
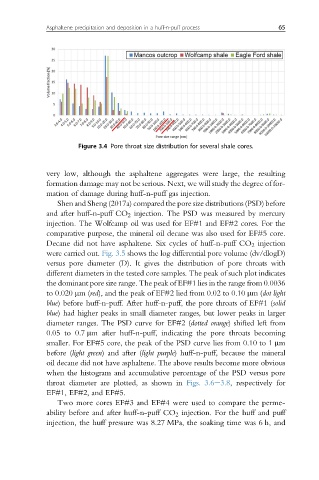
Figure 3.4 Pore throat size distribution for several shale cores.
very low, although the asphaltene aggregates were large, the resulting
formation damage may not be serious. Next, we will study the degree of for-
mation of damage during huff-n-puff gas injection.
Shen and Sheng (2017a) compared the pore size distributions (PSD) before
and after huff-n-puff CO 2 injection. The PSD was measured by mercury
injection. The Wolfcamp oil was used for EF#1 and EF#2 cores. For the
comparative purpose, the mineral oil decane was also used for EF#5 core.
Decane did not have asphaltene. Six cycles of huff-n-puff CO 2 injection
were carried out. Fig. 3.5 shows the log differential pore volume (dv/dlogD)
versus pore diameter (D). It gives the distribution of pore throats with
different diameters in the tested core samples. The peak of such plot indicates
the dominant pore size range. The peak of EF#1 lies in the range from 0.0036
to 0.020 mm(red), and the peak of EF#2 lied from 0.02 to 0.10 mm(dot light
blue) before huff-n-puff. After huff-n-puff, the pore throats of EF#1 (solid
blue) had higher peaks in small diameter ranges, but lower peaks in larger
diameter ranges. The PSD curve for EF#2 (dotted orange) shifted left from
0.05 to 0.7 mm after huff-n-puff, indicating the pore throats becoming
smaller. For EF#5 core, the peak of the PSD curve lies from 0.10 to 1 mm
before (light green) and after (light purple) huff-n-puff, because the mineral
oil decane did not have asphaltene. The above results become more obvious
when the histogram and accumulative percentage of the PSD versus pore
throat diameter are plotted, as shown in Figs. 3.6e3.8, respectively for
EF#1, EF#2, and EF#5.
Two more cores EF#3 and EF#4 were used to compare the perme-
ability before and after huff-n-puff CO 2 injection. For the huff and puff
injection, the huff pressure was 8.27 MPa, the soaking time was 6 h, and