
Page 77 - Enhanced Oil Recovery in Shale and Tight Reservoirs
P. 77
64 Enhanced Oil Recovery in Shale and Tight Reservoirs
asphaltene content is the sum of the amount of asphaltene precipitated on
each membrane. It shows that with the increase in injected gas concentra-
tion, more asphaltene precipitated. It seems that the precipitated asphaltene
content for the Wolfcamp shale oil was very low.
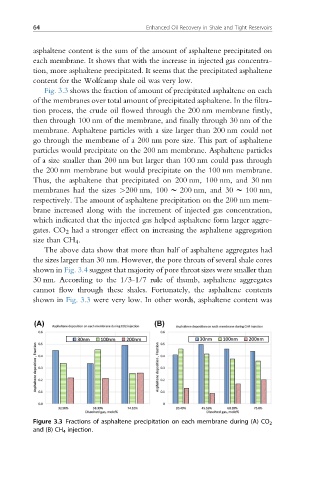
Fig. 3.3 shows the fraction of amount of precipitated asphaltene on each
of the membranes over total amount of precipitated asphaltene. In the filtra-
tion process, the crude oil flowed through the 200 nm membrane firstly,
then through 100 nm of the membrane, and finally through 30 nm of the
membrane. Asphaltene particles with a size larger than 200 nm could not
go through the membrane of a 200 nm pore size. This part of asphaltene
particles would precipitate on the 200 nm membrane. Asphaltene particles
of a size smaller than 200 nm but larger than 100 nm could pass through
the 200 nm membrane but would precipitate on the 100 nm membrane.
Thus, the asphaltene that precipitated on 200 nm, 100 nm, and 30 nm
membranes had the sizes >200 nm, 100 w 200 nm, and 30 w 100 nm,
respectively. The amount of asphaltene precipitation on the 200 nm mem-
brane increased along with the increment of injected gas concentration,
which indicated that the injected gas helped asphaltene form larger aggre-
gates. CO 2 had a stronger effect on increasing the asphaltene aggregation
size than CH 4 .
The above data show that more than half of asphaltene aggregates had
the sizes larger than 30 nm. However, the pore throats of several shale cores
shown in Fig. 3.4 suggest that majority of pore throat sizes were smaller than
30 nm. According to the 1/3-1/7 rule of thumb, asphaltene aggregates
cannot flow through these shales. Fortunately, the asphaltene contents
shown in Fig. 3.3 were very low. In other words, asphaltene content was
Figure 3.3 Fractions of asphaltene precipitation on each membrane during (A) CO 2
and (B) CH 4 injection.