
Page 127 - Environmental Nanotechnology Applications and Impacts of Nanomaterials
P. 127
Methods for Structural and Chemical Characterization of Nanomaterials 113
msEd 2 m sEd
0
skd 5
m sEd
0
N i 2 2 2 2R i
0
2
52S Zf skdZe 22s i k e lskd sin[2kR 1 f skd] (2)
i
ij
i
i kR i 2
where (E) is the measured absorption coefficient, (E) is a background
0
function representing the absorption of an isolated atom, ∆ (E) is the
0
2
jump in the absorption coefficient at the energy of the edge, S 0 is the
amplitude reduction factor due to multielectronic effects. N is the coor-
i
dination number, R is the interatomic distance between the central
i
atom and the neighboring atom of type i, is a Debye-Waller factor
i
describing the static and dynamic disorder in a Gaussian approxima-
tion, Zf skdZ is the amplitude of the backscattering wave from the neigh-
i
bor of type i, (k) is the free mean path of the photoelectron, that
skd is the phase shift between the
accounts for inelastic losses, and f ij
central ion j and its neighbors i. From Eq. 2 it is possible to extract from
EXAFS oscillations information such as the interatomic distances and
the number and nature of surrounding atoms.
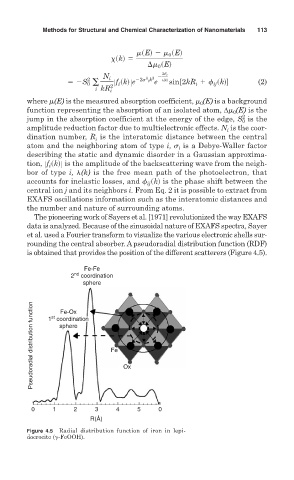
The pioneering work of Sayers et al. [1971] revolutionized the way EXAFS
data is analyzed. Because of the sinusoidal nature of EXAFS spectra, Sayer
et al. used a Fourier transform to visualize the various electronic shells sur-
rounding the central absorber. Apseudoradial distribution function (RDF)
is obtained that provides the position of the different scatterers (Figure 4.5).
Fe-Fe
nd
2 coordination
sphere
Pseudoradial distribution function 1 coordination Fe Ox
Fe-Ox
st
sphere
0 1 2 3 4 5 0
R(Å)
Figure 4.5 Radial distribution function of iron in lepi-
docrocite ( -FeOOH).