
Page 126 - Environmental Nanotechnology Applications and Impacts of Nanomaterials
P. 126
112 Principles and Methods
Pre-edge
XANES EXAFS
Edge
or white line
5990 6000
Absorbance (a.u.)
6000 6500
Energy (eV)
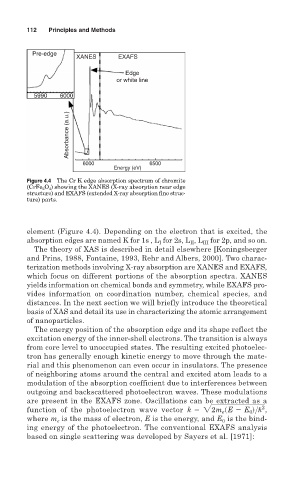
Figure 4.4 The Cr K edge absorption spectrum of chromite
(CrFe 2 O 4 ) showing the XANES (X-ray absorption near edge
structure) and EXAFS (extended X-ray absorption fine struc-
ture) parts.
element (Figure 4.4). Depending on the electron that is excited, the
absorption edges are named K for 1s , L for 2s, L , L III for 2p, and so on.
II
I
The theory of XAS is described in detail elsewhere [Koningsberger
and Prins, 1988, Fontaine, 1993, Rehr and Albers, 2000]. Two charac-
terization methods involving X-ray absorption are XANES and EXAFS,
which focus on different portions of the absorption spectra. XANES
yields information on chemical bonds and symmetry, while EXAFS pro-
vides information on coordination number, chemical species, and
distances. In the next section we will briefly introduce the theoretical
basis of XAS and detail its use in characterizing the atomic arrangement
of nanoparticles.
The energy position of the absorption edge and its shape reflect the
excitation energy of the inner-shell electrons. The transition is always
from core level to unoccupied states. The resulting excited photoelec-
tron has generally enough kinetic energy to move through the mate-
rial and this phenomenon can even occur in insulators. The presence
of neighboring atoms around the central and excited atom leads to a
modulation of the absorption coefficient due to interferences between
outgoing and backscattered photoelectron waves. These modulations
are present in the EXAFS zone. Oscillations can be extracted as a
function of the photoelectron wave vector k 5 22m sE 2 E d>U 2 ,
0
e
where m e is the mass of electron, E is the energy, and E 0 is the bind-
ing energy of the photoelectron. The conventional EXAFS analysis
based on single scattering was developed by Sayers et al. [1971]: