
Page 149 - Environmental Nanotechnology Applications and Impacts of Nanomaterials
P. 149
Methods for Structural and Chemical Characterization of Nanomaterials 135
2000 g/mol (i.e., n~ 28) in 1 L. The density of the resulting solution is
3
1.06 g/cm . First, the solution is mounted in a variable light path X-ray
cell for measuring its transmission as a function of its thickness. The
transmission T of a monochromatic X-ray beam obeys the following
relationship:
I 2m*>re
5 e (22)
I o
~
2
where
is the mass absorption coefficient (cm /g), e d d is the thick-
ness, and the density. The mass absorption coefficient is tabulated for
each atom at all X-ray incident energies. (The mass absorption coeffi-
cient can be found on the NIST website http://www.nist.gov). For a mix
of compounds, the average mass attenuation coefficient is obtained with
the following formulation:
m*
x sm/rd
r 5 i i (23)
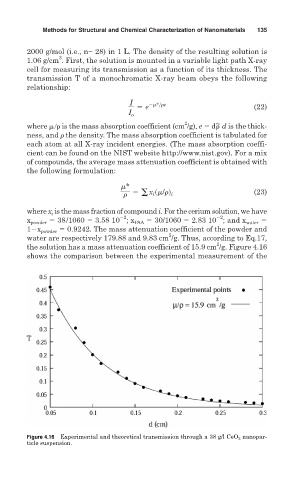
where x is the mass fraction of compound i. For the cerium solution, we have
i
2
2
x powder 38/1060 3.58 10 ; x PAA 30/1060 2.83 10 ; and x water
1 x powder 0.9242. The mass attenuation coefficient of the powder and
2
water are respectively 179.88 and 9.83 cm /g. Thus, according to Eq.17,
2
the solution has a mass attenuation coefficient of 15.9 cm /g. Figure 4.16
shows the comparison between the experimental measurement of the
Figure 4.16 Experimental and theoretical transmission through a 38 g/l CeO 2 nanopar-
ticle suspension.