
Page 154 - Environmental Nanotechnology Applications and Impacts of Nanomaterials
P. 154
140 Principles and Methods
25
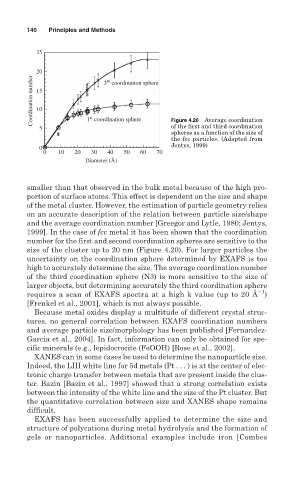
20 3 coordination sphere
Coordination number 15
rd
10
st
of the first and third coordination
5 1 coordination sphere Figure 4.20 Average coordination
spheres as a function of the size of
the fcc particles. (Adapted from
Jentys, 1999)
0
0 10 20 30 40 50 60 70
Diameter (Å)
smaller than that observed in the bulk metal because of the high pro-
portion of surface atoms. This effect is dependent on the size and shape
of the metal cluster. However, the estimation of particle geometry relies
on an accurate description of the relation between particle size/shape
and the average coordination number [Greegor and Lytle, 1980; Jentys,
1999]. In the case of fcc metal it has been shown that the coordination
number for the first and second coordination spheres are sensitive to the
size of the cluster up to 20 nm (Figure 4.20). For larger particles the
uncertainty on the coordination sphere determined by EXAFS is too
high to accurately determine the size. The average coordination number
of the third coordination sphere (N3) is more sensitive to the size of
larger objects, but determining accurately the third coordination sphere
1
requires a scan of EXAFS spectra at a high k value (up to 20 Å )
[Frenkel et al., 2001], which is not always possible.
Because metal oxides display a multitude of different crystal struc-
tures, no general correlation between EXAFS coordination numbers
and average particle size/morphology has been published [Fernandez-
Garcia et al., 2004]. In fact, information can only be obtained for spe-
cific minerals (e.g., lepidocrocite (FeOOH) [Rose et al., 2002].
XANES can in some cases be used to determine the nanoparticle size.
Indeed, the LIII white line for 5d metals (Pt . . . ) is at the center of elec-
tronic charge transfer between metals that are present inside the clus-
ter. Bazin [Bazin et al., 1997] showed that a strong correlation exists
between the intensity of the white line and the size of the Pt cluster. But
the quantitative correlation between size and XANES shape remains
difficult.
EXAFS has been successfully applied to determine the size and
structure of polycations during metal hydrolysis and the formation of
gels or nanoparticles. Additional examples include iron [Combes