
Page 153 - Environmental Nanotechnology Applications and Impacts of Nanomaterials
P. 153
Methods for Structural and Chemical Characterization of Nanomaterials 139
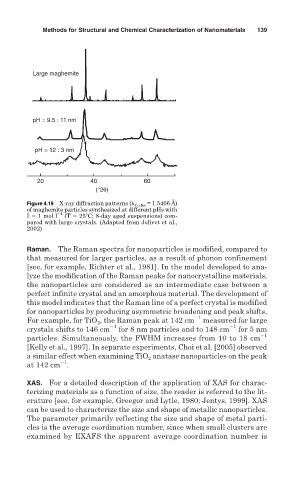
Large maghemite
pH = 9.5 : 11 nm
pH = 12 : 3 nm
20 40 60
(°2θ)
Figure 4.19 X-ray diffraction patterns ( Cu K = 1.5406 Å)
of maghemite particles synthesized at different pHs with
I 1 mol l 1 (T 25 C; 8-day aged suspensions) com-
pared with large crystals. (Adapted from Jolivet et al.,
2002)
Raman. The Raman spectra for nanoparticles is modified, compared to
that measured for larger particles, as a result of phonon confinement
[see, for example, Richter et al., 1981]. In the model developed to ana-
lyze the modification of the Raman peaks for nanocrystalline materials,
the nanoparticles are considered as an intermediate case between a
perfect infinite crystal and an amorphous material. The development of
this model indicates that the Raman line of a perfect crystal is modified
for nanoparticles by producing asymmetric broadening and peak shifts.
1
For example, for TiO , the Raman peak at 142 cm measured for large
2
crystals shifts to 146 cm 1 for 8 nm particles and to 148 cm 1 for 5 nm
1
particles. Simultaneously, the FWHM increases from 10 to 18 cm
[Kelly et al., 1997]. In separate experiments, Choi et al. [2005] observed
a similar effect when examining TiO anatase nanoparticles on the peak
2
1
at 142 cm .
XAS. For a detailed description of the application of XAS for charac-
terizing materials as a function of size, the reader is referred to the lit-
erature [see, for example, Greegor and Lytle, 1980; Jentys, 1999]. XAS
can be used to characterize the size and shape of metallic nanoparticles.
The parameter primarily reflecting the size and shape of metal parti-
cles is the average coordination number, since when small clusters are
examined by EXAFS the apparent average coordination number is