
Page 155 - Environmental Nanotechnology Applications and Impacts of Nanomaterials
P. 155
Methods for Structural and Chemical Characterization of Nanomaterials 141
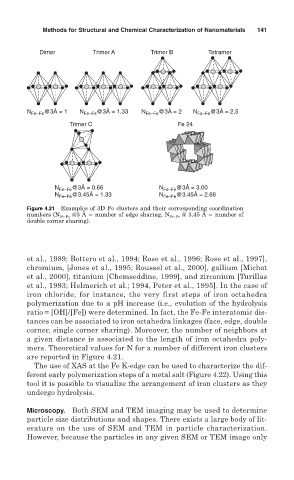
Dimer Trimer A Trimer B Tetramer
@3Å = 1 N @3Å = 1.33 @3Å = 2 @3Å = 2.5
N Fe–Fe Fe–Fe N Fe–Fe N Fe–Fe
Trimer C Fe 24
N Fe–Fe @3Å = 0.66 N Fe–Fe @3Å = 3.00
N Fe–Fe @3.45Å = 1.33 N Fe–Fe @3.45Å = 2.66
Figure 4.21 Examples of 3D Fe clusters and their corresponding coordination
numbers (N Fe-Fe @3 Å number of edge sharing, N Fe-Fe @ 3.45 Å number of
double corner sharing).
et al., 1989; Bottero et al., 1994; Rose et al., 1996; Rose et al., 1997],
chromium, [Jones et al., 1995; Roussel et al., 2000], gallium [Michot
et al., 2000], titanium [Chemseddine, 1999], and zirconium [Turillas
et al., 1993; Helmerich et al.; 1994, Peter et al., 1995]. In the case of
iron chloride, for instance, the very first steps of iron octahedra
polymerization due to a pH increase (i.e., evolution of the hydrolysis
ratio = [OH]/[Fe]) were determined. In fact, the Fe-Fe interatomic dis-
tances can be associated to iron octahedra linkages (face, edge, double
corner, single corner sharing). Moreover, the number of neighbors at
a given distance is associated to the length of iron octahedra poly-
mers. Theoretical values for N for a number of different iron clusters
are reported in Figure 4.21.
The use of XAS at the Fe K-edge can be used to characterize the dif-
ferent early polymerization steps of a metal salt (Figure 4.22). Using this
tool it is possible to visualize the arrangement of iron clusters as they
undergo hydrolysis.
Microscopy. Both SEM and TEM imaging may be used to determine
particle size distributions and shapes. There exists a large body of lit-
erature on the use of SEM and TEM in particle characterization.
However, because the particles in any given SEM or TEM image only