
Page 156 - Environmental Nanotechnology Applications and Impacts of Nanomaterials
P. 156
142 Principles and Methods
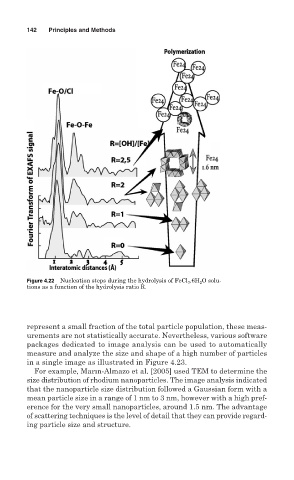
Figure 4.22 Nucleation steps during the hydrolysis of FeCl 3 .6H 2 O solu-
tions as a function of the hydrolysis ratio R.
represent a small fraction of the total particle population, these meas-
urements are not statistically accurate. Nevertheless, various software
packages dedicated to image analysis can be used to automatically
measure and analyze the size and shape of a high number of particles
in a single image as illustrated in Figure 4.23.
For example, Marın-Almazo et al. [2005] used TEM to determine the
size distribution of rhodium nanoparticles. The image analysis indicated
that the nanoparticle size distribution followed a Gaussian form with a
mean particle size in a range of 1 nm to 3 nm, however with a high pref-
erence for the very small nanoparticles, around 1.5 nm. The advantage
of scattering techniques is the level of detail that they can provide regard-
ing particle size and structure.