
Page 161 - Environmental Nanotechnology Applications and Impacts of Nanomaterials
P. 161
Methods for Structural and Chemical Characterization of Nanomaterials 147
4+
458.8 eV for TiO 2 (Ti ) [(Song et al., 2005]. In the case of Mo metallic
nanoparticles, XPS can probe for surface oxidation. Indeed, the two peaks
of the 3D photoemission vary from 231.6, 228.3 eV to 235.8 and 232.7 eV
for metallic and 6+ Mo oxidation state. The presence of the 235.8 and
232.7 eV peaks fingerprint the oxidation of Mo nanoparticles [Song, 2003].
Bulk redox sensitive spectroscopies. X-ray absorption spectroscopy and
Mössbauer spectroscopy are redox sensitive techniques. The information
is not specific from the surface or near surface region. Therefore if a
modification of the oxidation state of the nanoparticles occurs it is almost
impossible to attribute it to a bulk or surface oxidation. Moreover, if oxi-
dation occurs at the surface, since both techniques provide information
from all atoms of the particles, if the fraction of surface atoms is low
(large particles) the signal will not be affected. XAS and Mössbauer can
only determine the evolution of surface oxidation state for small parti-
cles (<20–50 nm) as soon as the fraction of surface atoms is higher than
15–20 percent.
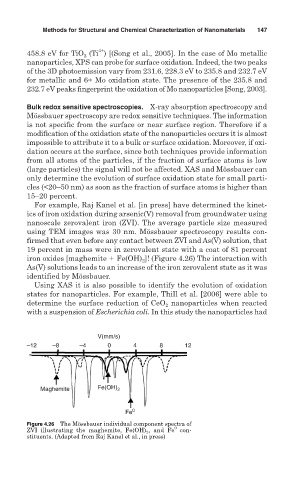
For example, Raj Kanel et al. [in press] have determined the kinet-
ics of iron oxidation during arsenic(V) removal from groundwater using
nanoscale zerovalent iron (ZVI). The average particle size measured
using TEM images was 30 nm. Mössbauer spectroscopy results con-
firmed that even before any contact between ZVI and As(V) solution, that
19 percent in mass were in zerovalent state with a coat of 81 percent
iron oxides [maghemite Fe(OH) 2 ]! (Figure 4.26) The interaction with
As(V) solutions leads to an increase of the iron zerovalent state as it was
identified by Mössbauer.
Using XAS it is also possible to identify the evolution of oxidation
states for nanoparticles. For example, Thill et al. [2006] were able to
determine the surface reduction of CeO 2 nanoparticles when reacted
with a suspension of Escherichia coli. In this study the nanoparticles had
V(mm/s)
–12 –8 –4 0 4 8 12
Maghemite Fe(OH) 2
Fe 0
Figure 4.26 The Mössbauer individual component spectra of
0
ZVI illustrating the maghemite, Fe(OH) 2 , and Fe con-
stituents. (Adapted from Raj Kanel et al., in press)