
Page 275 - Environmental Nanotechnology Applications and Impacts of Nanomaterials
P. 275
260 Principles and Methods
1.0
0.8
1-n/n o 0.6 Nanoparticles
dp < 100 nm
0.4
0.2
α = 1.0
α = 0.5
0.0
0.01 0.1 1 10
dp (µm)
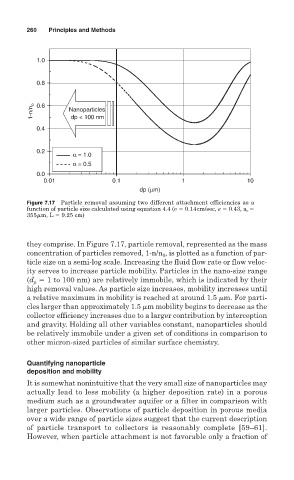
Figure 7.17 Particle removal assuming two different attachment efficiencies as a
function of particle size calculated using equation 4.4 (v 0.14cm/sec, 0.43, a c
355 m, L 9.25 cm)
they comprise. In Figure 7.17, particle removal, represented as the mass
concentration of particles removed, 1-n/n , is plotted as a function of par-
0
ticle size on a semi-log scale. Increasing the fluid flow rate or flow veloc-
ity serves to increase particle mobility. Particles in the nano-size range
(d 1 to 100 nm) are relatively immobile, which is indicated by their
p
high removal values. As particle size increases, mobility increases until
a relative maximum in mobility is reached at around 1.5 m. For parti-
cles larger than approximately 1.5 m mobility begins to decrease as the
collector efficiency increases due to a larger contribution by interception
and gravity. Holding all other variables constant, nanoparticles should
be relatively immobile under a given set of conditions in comparison to
other micron-sized particles of similar surface chemistry.
Quantifying nanoparticle
deposition and mobility
It is somewhat nonintuitive that the very small size of nanoparticles may
actually lead to less mobility (a higher deposition rate) in a porous
medium such as a groundwater aquifer or a filter in comparison with
larger particles. Observations of particle deposition in porous media
over a wide range of particle sizes suggest that the current description
of particle transport to collectors is reasonably complete [59–61].
However, when particle attachment is not favorable only a fraction of