
Page 270 - Environmental Nanotechnology Applications and Impacts of Nanomaterials
P. 270
Nanoparticle Transport, Aggregation, and Deposition 255
the sixth power of the counterion valence, as predicted by the Schulze-
Hardy rule for ideal systems [56].
It is interesting to note that these CCCs are on the order of the salin-
ity of water in freshwater and ocean environments. This implies that in
the natural aquatic system, the stability of these nanoparticle clusters
should be highly sensitive to the water salinity. The influence of ionic
suggests that the stability of
strength on the initial formation of nC 60
fullerene dispersions is largely electrostatic in origin and that the mag-
nitude and range of these interactions determine cluster growth rates
and size [33, 34, 49].
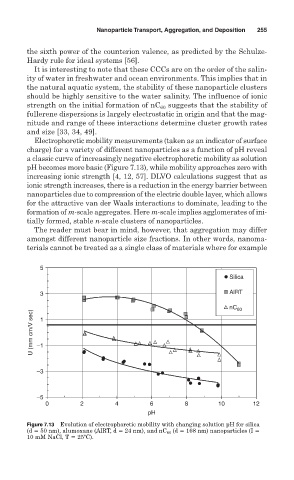
Electrophoretic mobility measurements (taken as an indicator of surface
charge) for a variety of different nanoparticles as a function of pH reveal
a classic curve of increasingly negative electrophoretic mobility as solution
pH becomes more basic (Figure 7.13), while mobility approaches zero with
increasing ionic strength [4, 12, 57]. DLVO calculations suggest that as
ionic strength increases, there is a reduction in the energy barrier between
nanoparticles due to compression of the electric double layer, which allows
for the attractive van der Waals interactions to dominate, leading to the
formation of m-scale aggregates. Here m-scale implies agglomerates of ini-
tially formed, stable n-scale clusters of nanoparticles.
The reader must bear in mind, however, that aggregation may differ
amongst different nanoparticle size fractions. In other words, nanoma-
terials cannot be treated as a single class of materials where for example
5
Silica
3 AlRT
nC 60
U (mm cm/V sec) –1
1
–3
–5
0 2 4 6 8 10 12
pH
Figure 7.13 Evolution of electrophoretic mobility with changing solution pH for silica
(d 50 nm), alumoxane (AlRT, d 24 nm), and nC 60 (d 168 nm) nanoparticles (I
10 mM NaCl, T 25ºC).