
Page 269 - Environmental Nanotechnology Applications and Impacts of Nanomaterials
P. 269
254 Principles and Methods
Ionic strength effects
Qualitative trends predicted by DLVO-type models have been observed
in nanoparticle suspensions—that is, that particles tend to aggregate
more quickly at higher ionic strengths and/or at pH values near the point
of zero charge [55]. Both of these changes in solution chemistry reduce
repulsive electrostatic interactions. Adherence of nanoparticle stability
to classical colloidal models is illustrated by the case of nC 60 aggrega-
tion in two different electrolytes, NaCl and CaCl 2 , of variable concen-
tration (Figure 7.12).
The average diffusion coefficient sD nC 60 d of nC 60 clusters and higher
order aggregates is inversely correlated to the average size of the aggre-
gates via the Stokes-Einstein relation:
kT
5 (16)
R h
6pmD
where R is the average cluster (nC ) hydrodynamic diameter. When the
h
60
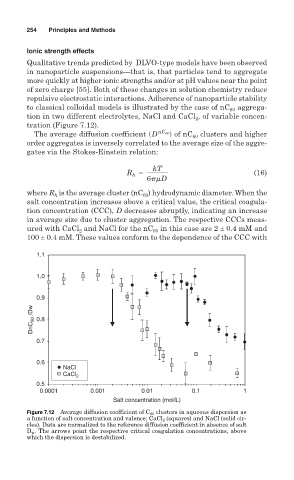
salt concentration increases above a critical value, the critical coagula-
tion concentration (CCC), D decreases abruptly, indicating an increase
in average size due to cluster aggregation. The respective CCCs meas-
ured with CaCl and NaCl for the nC in this case are 2 ± 0.4 mM and
60
2
100 ± 0.4 mM. These values conform to the dependence of the CCC with
1.1
1.0
0.9
DnC 60 /Dw 0.8
0.7
0.6
NaCl
CaCl 2
0.5
0.0001 0.001 0.01 0.1 1
Salt concentration (mol/L)
Figure 7.12 Average diffusion coefficient of C 60 clusters in aqueous dispersion as
a function of salt concentration and valence; CaCl 2 (squares) and NaCl (solid cir-
cles). Data are normalized to the reference diffusion coefficient in absence of salt
D w . The arrows point the respective critical coagulation concentrations, above
which the dispersion is destabilized.