
Page 279 - Environmental Nanotechnology Applications and Impacts of Nanomaterials
P. 279
264 Principles and Methods
attachment are reduced. This is best explained by a reduction in repul-
sive electrostatic interactions, which are most sensitive to changes in
ionic strength and valency.
Theory suggests that as particle size decreases, the attachment effi-
ciency should increase [63] due to a reduction in the height of the energy
barrier. However, experiments with model systems looking at both par-
ticle stability and mobility have found that the attachment efficiency is
largely insensitive to particle size. This discrepancy between theory
and reality is attributed to an incomplete assessment of interfacial
interaction energies and to changes in the nature of interactions with
decreasing particle size. It is therefore unclear whether nanoparticles
should be inherently less stable or more prone to depositing onto sur-
faces under favorable conditions than are larger particles.
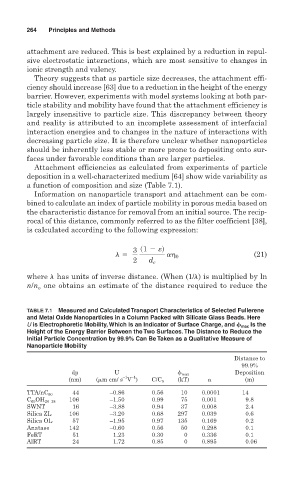
Attachment efficiencies as calculated from experiments of particle
deposition in a well-characterized medium [64] show wide variability as
a function of composition and size (Table 7.1).
Information on nanoparticle transport and attachment can be com-
bined to calculate an index of particle mobility in porous media based on
the characteristic distance for removal from an initial source. The recip-
rocal of this distance, commonly referred to as the filter coefficient [38],
is calculated according to the following expression:
3 s1 2 ed
l 5 a 0 (21)
2 d c
where has units of inverse distance. (When (1/ ) is multiplied by ln
n/n one obtains an estimate of the distance required to reduce the
o
TABLE 7.1 Measured and Calculated Transport Characteristics of Selected Fullerene
and Metal Oxide Nanoparticles in a Column Packed with Silicate Glass Beads. Here
U is Electrophoretic Mobility, Which Is an Indicator of Surface Charge, and max Is the
Height of the Energy Barrier Between the Two Surfaces.The Distance to Reduce the
Initial Particle Concentration by 99.9% Can Be Taken as a Qualitative Measure of
Nanoparticle Mobility
Distance to
99.9%
dp U max Deposition
–1
–1
(nm) ( m cm/ s V ) C/C 0 (kT) (m)
44 –0.86 0.56 10 0.0001 14
TTA/nC 60
106 –1.50 0.99 75 0.001 9.8
C 60 OH 20–24
SWNT 16 –3.88 0.94 37 0.008 2.4
Silica ZL 106 –3.20 0.68 297 0.039 0.6
Silica OL 57 –1.95 0.97 135 0.169 0.2
Anatase 142 –0.60 0.56 50 0.298 0.1
FeRT 51 1.23 0.30 0 0.336 0.1
AlRT 24 1.72 0.85 0 0.895 0.06