
Page 282 - Environmental Nanotechnology Applications and Impacts of Nanomaterials
P. 282
Nanoparticle Transport, Aggregation, and Deposition 267
y
v x
F L
F D
F A
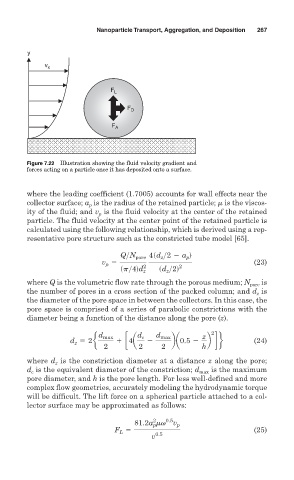
Figure 7.22 Illustration showing the fluid velocity gradient and
forces acting on a particle once it has deposited onto a surface.
where the leading coefficient (1.7005) accounts for wall effects near the
collector surface; a is the radius of the retained particle; is the viscos-
p
ity of the fluid; and v is the fluid velocity at the center of the retained
p
particle. The fluid velocity at the center point of the retained particle is
calculated using the following relationship, which is derived using a rep-
resentative pore structure such as the constricted tube model [65].
Q>N pore 4sd >2 2 a d
z
p
v 5 2 2 (23)
p
sp>4dd z sd z >2d
where Q is the volumetric flow rate through the porous medium; N pore is
the number of pores in a cross section of the packed column; and d is
z
the diameter of the pore space in between the collectors. In this case, the
pore space is comprised of a series of parabolic constrictions with the
diameter being a function of the distance along the pore (z).
d d 2
d max c max z
d z 5 2 e 1 c4a 2 ba0.5 2 b df (24)
2 2 2 h
where d is the constriction diameter at a distance z along the pore;
z
d is the equivalent diameter of the constriction; d max is the maximum
c
pore diameter, and h is the pore length. For less well-defined and more
complex flow geometries, accurately modeling the hydrodynamic torque
will be difficult. The lift force on a spherical particle attached to a col-
lector surface may be approximated as follows:
2
0.5
81.2a mv v p
p
F 5 (25)
L
v 0.5