
Page 278 - Environmental Nanotechnology Applications and Impacts of Nanomaterials
P. 278
Nanoparticle Transport, Aggregation, and Deposition 263
kinetic energy imparted to them by the fluid flow. As particle size
decreases, the secondary minimum becomes shallower, while the energy
barrier decreases in height. In this way a transition between deposition
in the secondary and primary minima will exist according to particle
size. For example, Petit et al. [1973] found that for selenium sols this
transition from primary to secondary minima deposition occurred at a
particle size of around 55 nm. In other words, particles larger than
55 nm deposited in the secondary minimum while those smaller than
55 nm deposited in the primary minimum. This value of course will
vary as a function of solution chemistry and particle-surface chemistry.
In most cases relatively good agreement exists between model
predictions and experimental results when favorable deposition condi-
tions exist, while there is more disagreement when unfavorable condi-
tions are present. Deposition in the secondary minimum may resolve
some of the discrepancy between theoretical and observed values of the
attachment efficiency.
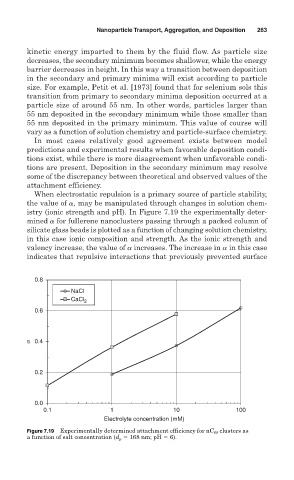
When electrostatic repulsion is a primary source of particle stability,
the value of , may be manipulated through changes in solution chem-
istry (ionic strength and pH). In Figure 7.19 the experimentally deter-
mined for fullerene nanoclusters passing through a packed column of
silicate glass beads is plotted as a function of changing solution chemistry,
in this case ionic composition and strength. As the ionic strength and
valency increase, the value of increases. The increase in in this case
indicates that repulsive interactions that previously prevented surface
0.8
NaCl
CaCl 2
0.6
α 0.4
0.2
0.0
0.1 1 10 100
Electrolyte concentration (mM)
Figure 7.19 Experimentally determined attachment efficiency for nC 60 clusters as
a function of salt concentration (d p 168 nm; pH 6).