
Page 297 - Environmental Nanotechnology Applications and Impacts of Nanomaterials
P. 297
282 Principles and Methods
where R and R are the respective diameters of the particles and the
A
p
pores;
is the gel volume fraction. This equation is based on a number
of limiting assumptions such as the particles being perfect spheres and
the particle and pore sizes being described each by a single value.
Although the theoretical constraints of this equation will rarely be met
in natural gels and biofilms, it provides some insight into the role of par-
ticle and pore size as they affect the steric contribution.
Steric effects on diffusion can also be viewed in terms of decrease in
2
mean squared displacement, x std A , that occurs as the particle moves
through a fractal structure [97, 103–107]:
2
A
x std 5 t 2>d w (32)
where d is the fractal dimension of diffusion and is proportional to
w
the constrained diffusion coefficient. In normal random diffusion, d w is
equal to 2 (Eq. 29). In anomalous diffusion, d w greater than 2 corre-
sponds to the slowing down of the transport caused by the delay of the
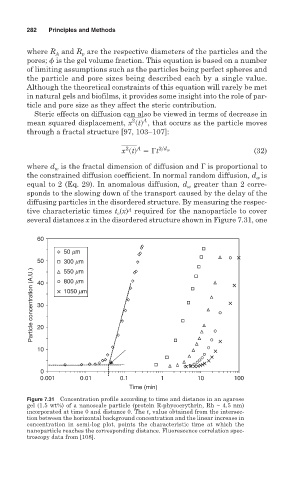
diffusing particles in the disordered structure. By measuring the respec-
A
tive characteristic times t c (x) required for the nanoparticle to cover
several distances x in the disordered structure shown in Figure 7.31, one
60
50 mm
50 300 mm
Particle concentration (A.U.) 40 1050 mm
550 mm
800 mm
30
20
10
0
0.001 0.01 0.1 1 10 100
Time (min)
Figure 7.31 Concentration profile according to time and distance in an agarose
gel (1.5 wt%) of a nanoscale particle (protein R-phycoerythrin, Rh ~ 4.5 nm)
incorporated at time 0 and distance 0. The t c value obtained from the intersec-
tion between the horizontal background concentration and the linear increase in
concentration in semi-log plot, points the characteristic time at which the
nanoparticle reaches the corresponding distance. Fluorescence correlation spec-
troscopy data from [108].