Page 393 - Environmental Nanotechnology Applications and Impacts of Nanomaterials
P. 393
376   Environmental Applications of Nanomaterials

        Adsorption/desorption experiments
        The maximum adsorption capacity of an adsorbent is usually evaluated
        using adsorption isotherms. The results of adsorption experiments can
        be presented as a curve showing the amount of adsorbate taken up per
        unit weight or area of the adsorbent (in g or mol of adsorbates per g or
          2
        m of adsorbent) versus the equilibrium concentration remaining in solu-
        tion. The pH, temperature, ionic strength, and concentration of the solid
        phase are maintained constant during the experiment. Numerous ana-
        lytical forms of the adsorption isotherms have been derived  (e.g.,
        Langmuir, Freundlich, Linear) that invoke differing underlying assump-
        tions, such as the existence of multiple adsorption layers, uniformity of
        the adsorption bond, and interactions between adsorption sites, to name
        a few (Sawyer et al., 2003; Stumm and Morgan, 1996). In macroscopic
        systems, adsorption data can be fitted with these equations in order to
        deduce thermodynamic and energetic information. However, they cannot
        lead to a thorough description of the different mechanisms in the case
        of a heterogeneous and finite surface.
          Many theories and models have been used to express desorption hys-
        teresis of hydrophobic organic compounds. These models express sorp-
        tion and desorption as different processes, such as the two-compartment
        desorption model. The basic concept of the model is that both sorption
        and desorption are biphasic, consisting of two compartments, each with
        unique equilibrium and kinetic characteristics. A model that accom-
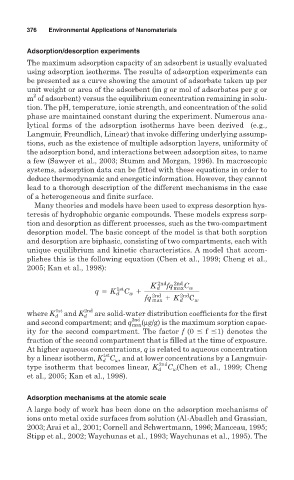
        plishes this is the following equation (Chen et al., 1999; Cheng et al.,
        2005; Kan et al., 1998):

                                            2nd
                                                 2nd
                                          K d fq max C w
                                  1st
                           q 5 K d C 1
                                    w
                                           2nd
                                                  2nd
                                        fq max 1 K d C w
                1st
        where K d and K d 2nd  are solid-water distribution coefficients for the first
                                     2nd
        and second compartment; and q max (µg/g) is the maximum sorption capac-
        ity for the second compartment. The factor f (0   f  1) denotes the
        fraction of the second compartment that is filled at the time of exposure.
        At higher aqueous concentrations, q is related to aqueous concentration
                             1st
        by a linear isotherm, K d C w , and at lower concentrations by a Langmuir-
                                            2nd
        type isotherm that becomes linear, K d C w (Chen et al., 1999; Cheng
        et al., 2005; Kan et al., 1998).
        Adsorption mechanisms at the atomic scale
        A large body of work has been done on the adsorption mechanisms of
        ions onto metal oxide surfaces from solution (Al-Abadleh and Grassian,
        2003; Arai et al., 2001; Cornell and Schwertmann, 1996; Manceau, 1995;
        Stipp et al., 2002; Waychunas et al., 1993; Waychunas et al., 1995). The

