
Page 202 - Essentials of physical chemistry
P. 202
164 Essentials of Physical Chemistry
person using these equations for research that the appropriate constants could be stored in a simple
computer program in BASIC or JAVA and all that needs to be given to the program as input data is
the desired temperature and the slope of the ln (K) plot.
FURTHER CONSIDERATION OF SN1 SOLVOLYSIS
The problem from Brown and Borkowski [5] we have been considering above is rich in possible
details for further study. At this point, we only want to make two comments. First, we want to
expand your understanding of the activation barrier. In Freshman texts and even some organic
chemistry texts, the activation energy is usually presented in the Arrhenius form with a single
energy barrier and an exothermal release of DH rxn .
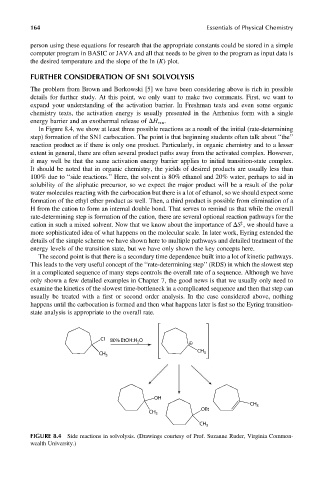
In Figure 8.4, we show at least three possible reactions as a result of the initial (rate-determining
step) formation of the SN1 carbocation. The point is that beginning students often talk about ‘‘the’’
reaction product as if there is only one product. Particularly, in organic chemistry and to a lesser
extent in general, there are often several product paths away from the activated complex. However,
it may well be that the same activation energy barrier applies to initial transition-state complex.
It should be noted that in organic chemistry, the yields of desired products are usually less than
100% due to ‘‘side reactions.’’ Here, the solvent is 80% ethanol and 20% water, perhaps to aid in
solubility of the aliphatic precursor, so we expect the major product will be a result of the polar
water molecules reacting with the carbocation but there is a lot of ethanol, so we should expect some
formation of the ethyl ether product as well. Then, a third product is possible from elimination of a
H from the cation to form an internal double bond. That serves to remind us that while the overall
rate-determining step is formation of the cation, there are several optional reaction pathways for the
cation in such a mixed solvent. Now that we know about the importance of DS , we should have a
z
more sophisticated idea of what happens on the molecular scale. In later work, Eyring extended the
details of the simple scheme we have shown here to multiple pathways and detailed treatment of the
energy levels of the transition state, but we have only shown the key concepts here.
The second point is that there is a secondary time dependence built into a lot of kinetic pathways.
This leads to the very useful concept of the ‘‘rate-determining step’’ (RDS) in which the slowest step
in a complicated sequence of many steps controls the overall rate of a sequence. Although we have
only shown a few detailed examples in Chapter 7, the good news is that we usually only need to
examine the kinetics of the slowest time-bottleneck in a complicated sequence and then that step can
usually be treated with a first or second order analysis. In the case considered above, nothing
happens until the carbocation is formed and then what happens later is fast so the Eyring transition-
state analysis is appropriate to the overall rate.
CI 80% EtOH:H 2 O
CH 3 CH 3
OH
CH 3
OEt
CH 3
CH 3
FIGURE 8.4 Side reactions in solvolysis. (Drawings courtesy of Prof. Suzanne Ruder, Virginia Common-
wealth University.)