
Page 246 - Essentials of physical chemistry
P. 246
208 Essentials of Physical Chemistry
One of the main changes in interpretation of electron orbits going from the Bohr rings to
Schrödinger ‘‘c clouds’’ is that the Schrödinger interpretation is more delocalized. A second key
difference is that the wave function has to be squared to obtain the actual probability as c * c ¼ r.
Rather than picturing electrons circling nuclei as in the Bohr model, the more recent interpretation is
that the electrons are very light and moving very fast so all we can say about their position is that
they are described by a function that is the square root of the probability, a wave function ‘‘cloud’’
rather than a ring. In Figures 9.13 and 9.14, we introduce pictures drawn of such wave functions in
the form of contour maps. Contour maps are 2D representations with a third dimension represented
as a closed line to show the outline of a ‘‘slice.’’ Contour maps are often used to show height in land
maps. It was not until the late 1960s and 1970s that computers were capable of easily calculating
such functions and making the drawings. The simple conclusion from Figures 9.13 and 9.14 is that
MnO 4 is a tetrahedral anion complex and each of the four O atoms is connected to the Mn atom by
two bonds (s þ p) for a total of eight bonds. Developments in chemistry and physics between
1913 and 1972 and on to 2010 are outlined in later chapters. Please note that while the derivations
in the later chapters are difficult, the emphasis is on learning the conclusions from those derivations,
so just ‘‘read’’ the derivations and pay attention to the results and it will not be difficult at all
(note the experimental facts in Table 9.3) if we learn to look for the conclusions, the ‘‘take home
message’’ of tedious calculations.
We have jumped ahead rapidly in the historical sequence of this chapter, because the Bohr atom
model cannot provide an explanation of the KMnO 4 spectrum and to encourage you to take the
second semester of physical chemistry to learn about more modern developments. But now what
does this mean relative to the purple color of KMnO 4 ? One of the limitations of this MS-Xa method
was that the only way you can get reasonable values for the transition energies between the
calculated orbitals is to use what became known as the ‘‘half-electron method.’’ In that method, it
was realized that if you excite an electron from the ground state to an upper orbital, there should be
some reorganization of the ground state orbital clouds. Thus, 0.5 of an electron was placed into the
occupied orbital and 0.5 of an electron was placed in the higher orbital to represent a ‘‘transition’’ for
an electronic excitation. At the time, this was accepted because it was an easy calculation and gives
reasonable results, but it was clearly the weakest part of the theoretical treatment. Today, there are
much more sophisticated ways to find the transition energies that account for the reorganization of
the other electrons when one is excited to a higher level. But here is the payoff. Using the calculated
HOMO ! LUMO energy as the 1t 1 ! 2e transition we find that
12, 398
¼ 5390 A ˚ ¼ 539 nm:
2:3 eV
l HOMO!LUMO ¼
Look back at Figure 9.10. While 525 nm is usually chosen as the most stable wavelength for
spectrophotometry, it is clear that overall, the peak of the absorbance spectrum is very close to 539 nm.
In fact, 539 nm is probably closer to the true transition energy of DE(1t 1 ! 2e) than 525 nm since
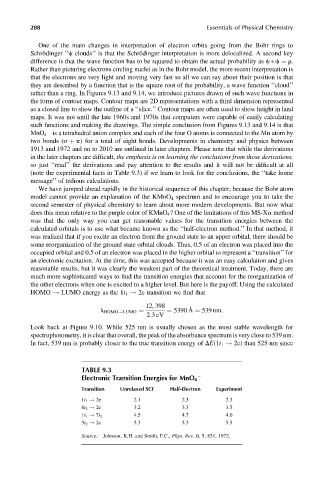
TABLE 9.3
Electronic Transition Energies for MnO 4
Transition Unrelaxed SCF Half-Electron Experiment
1t 1 ! 2e 2.1 2.3 2.3
6t 2 ! 2e 3.2 3.3 3.5
4.5 4.7 4.0
1t 1 ! 7t 2
5t 2 ! 2e 5.3 5.3 5.5
Source: Johnson, K.H. and Smith, F.C., Phys. Rev. B, 5, 831, 1972.