
Page 245 - Essentials of physical chemistry
P. 245
Basic Spectroscopy 207
4 3 2 5
1
6
9
8 5
5
7
8
5
4
9
3
6
21
1 2
1
7
2
4 3
8
9
9
8
5
7
5
6
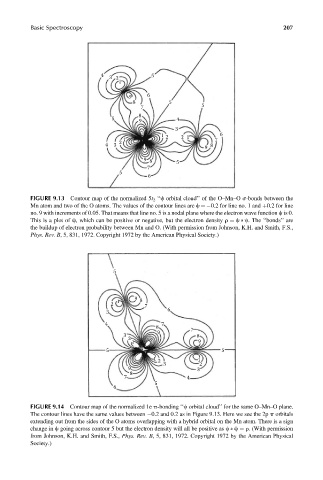
FIGURE 9.13 Contour map of the normalized 5t 2 ‘‘c orbital cloud’’ of the O–Mn–O s-bonds between the
Mn atom and two of the O atoms. The values of the contour lines are c ¼ 0.2 for line no. 1 and þ0.2 for line
no. 9 with increments of 0.05. That means that line no. 5 is a nodal plane where the electron wave function c is 0.
This is a plot of c, which can be positive or negative, but the electron density r ¼ c * c. The ‘‘bonds’’ are
the buildup of electron probability between Mn and O. (With permission from Johnson, K.H. and Smith, F.S.,
Phys. Rev. B, 5, 831, 1972. Copyright 1972 by the American Physical Society.)
5
9
8
1
2
7
6
3
4 7
8
7
9
3
8
2
9
1
5 5
1
1
2
3 2
9
3
8
7
4
5
6
FIGURE 9.14 Contour map of the normalized 1e p-bonding ‘‘c orbital cloud’’ for the same O–Mn–O plane.
The contour lines have the same values between 0.2 and 0.2 as in Figure 9.13. Here we see the 2p p orbitals
extending out from the sides of the O atoms overlapping with a hybrid orbital on the Mn atom. There is a sign
change in c going across contour 5 but the electron density will all be positive as c * c ¼ r. (With permission
from Johnson, K.H. and Smith, F.S., Phys. Rev. B, 5, 831, 1972. Copyright 1972 by the American Physical
Society.)