
Page 240 - Essentials of physical chemistry
P. 240
202 Essentials of Physical Chemistry
Pb
2000
1500
Pb
1000
500
Sb
Sb
As
Sc
Sc
Sc As
Sc
0
keV
0 5 10
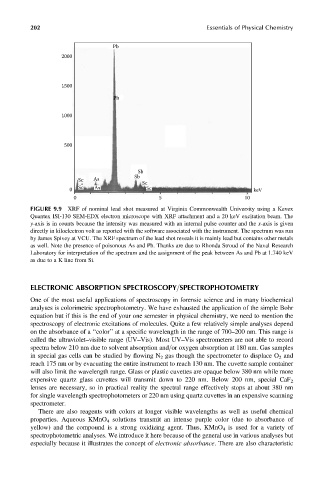
FIGURE 9.9 XRF of nominal lead shot measured at Virginia Commonwealth University using a Kevex
Quantex ISI-130 SEM-EDX electron microscope with XRF attachment and a 20 keV excitation beam. The
y-axis is in counts because the intensity was measured with an internal pulse counter and the x-axis is given
directly in kiloelectron volt as reported with the software associated with the instrument. The spectrum was run
by James Spivey at VCU. The XRF spectrum of the lead shot reveals it is mainly lead but contains other metals
as well. Note the presence of poisonous As and Pb. Thanks are due to Rhonda Stroud of the Naval Research
Laboratory for interpretation of the spectrum and the assignment of the peak between As and Pb at 1.740 keV
as due to a K line from Si.
ELECTRONIC ABSORPTION SPECTROSCOPY=SPECTROPHOTOMETRY
One of the most useful applications of spectroscopy in forensic science and in many biochemical
analyses is colorimetric spectrophotometry. We have exhausted the application of the simple Bohr
equation but if this is the end of your one semester in physical chemistry, we need to mention the
spectroscopy of electronic excitations of molecules. Quite a few relatively simple analyses depend
on the absorbance of a ‘‘color’’ at a specific wavelength in the range of 700–200 nm. This range is
called the ultraviolet–visible range (UV–Vis). Most UV–Vis spectrometers are not able to record
spectra below 210 nm due to solvent absorption and=or oxygen absorption at 180 nm. Gas samples
in special gas cells can be studied by flowing N 2 gas though the spectrometer to displace O 2 and
reach 175 nm or by evacuating the entire instrument to reach 130 nm. The cuvette sample container
will also limit the wavelength range. Glass or plastic cuvettes are opaque below 380 nm while more
expensive quartz glass cuvettes will transmit down to 220 nm. Below 200 nm, special CaF 2
lenses are necessary, so in practical reality the spectral range effectively stops at about 380 nm
for single wavelength spectrophotometers or 220 nm using quartz cuvettes in an expensive scanning
spectrometer.
There are also reagents with colors at longer visible wavelengths as well as useful chemical
properties. Aqueous KMnO 4 solutions transmit an intense purple color (due to absorbance of
yellow) and the compound is a strong oxidizing agent. Thus, KMnO 4 is used for a variety of
spectrophotometric analyses. We introduce it here because of the general use in various analyses but
especially because it illustrates the concept of electronic absorbance. There are also characteristic