
Page 306 - Excel 2007 Bible
P. 306
19_044039 ch14.qxp 11/21/06 11:06 AM Page 263
Creating Formulas That Count and Sum
FIGURE 14.7
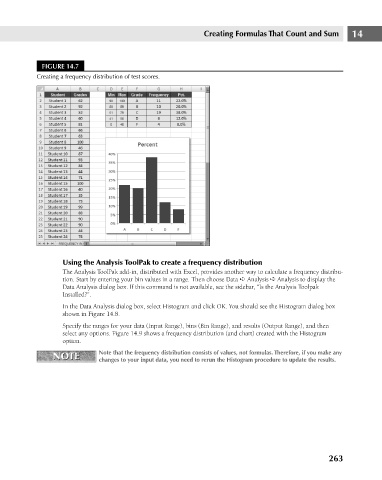
Creating a frequency distribution of test scores.
Using the Analysis ToolPak to create a frequency distribution 14
The Analysis ToolPak add-in, distributed with Excel, provides another way to calculate a frequency distribu-
tion. Start by entering your bin values in a range. Then choose Data ➪ Analysis ➪ Analysis to display the
Data Analysis dialog box. If this command is not available, see the sidebar, “Is the Analysis Toolpak
Installed?”.
In the Data Analysis dialog box, select Histogram and click OK. You should see the Histogram dialog box
shown in Figure 14.8.
Specify the ranges for your data (Input Range), bins (Bin Range), and results (Output Range), and then
select any options. Figure 14.9 shows a frequency distribution (and chart) created with the Histogram
option.
NOTE Note that the frequency distribution consists of values, not formulas. Therefore, if you make any
NOTE
changes to your input data, you need to rerun the Histogram procedure to update the results.
263