
Page 307 - Excel 2007 Bible
P. 307
19_044039 ch14.qxp 11/21/06 11:06 AM Page 264
Part II
Working with Formulas and Functions
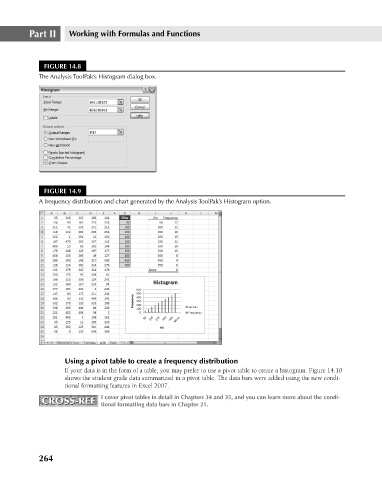
FIGURE 14.8
The Analysis ToolPak’s Histogram dialog box.
FIGURE 14.9
A frequency distribution and chart generated by the Analysis ToolPak’s Histogram option.
Using a pivot table to create a frequency distribution
If your data is in the form of a table, you may prefer to use a pivot table to create a histogram. Figure 14.10
shows the student grade data summarized in a pivot table. The data bars were added using the new condi-
tional formatting features in Excel 2007.
CROSS-REF I cover pivot tables in detail in Chapters 34 and 35, and you can learn more about the condi-
CROSS-REF
tional formatting data bars in Chapter 21.
264