
Page 304 - Excel 2007 Bible
P. 304
19_044039 ch14.qxp 11/21/06 11:06 AM Page 261
Creating Formulas That Count and Sum
The FREQUENCY function
Using the FREQUENCY function to create a frequency distribution can be a bit tricky. This function always
returns an array, so you must use it in an array formula that’s entered into a multicell range.
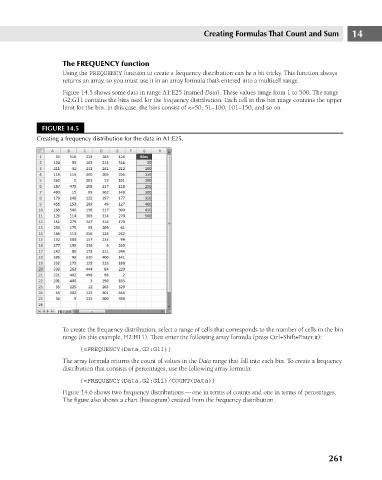
Figure 14.5 shows some data in range A1:E25 (named Data). These values range from 1 to 500. The range
G2:G11 contains the bins used for the frequency distribution. Each cell in this bin range contains the upper
limit for the bin. In this case, the bins consist of <=50, 51–100, 101–150, and so on.
FIGURE 14.5
Creating a frequency distribution for the data in A1:E25.
To create the frequency distribution, select a range of cells that corresponds to the number of cells in the bin 14
range (in this example, H2:H11). Then enter the following array formula (press Ctrl+Shift+Enter it):
{=FREQUENCY(Data,G2:G11)}
The array formula returns the count of values in the Data range that fall into each bin. To create a frequency
distribution that consists of percentages, use the following array formula:
{=FREQUENCY(Data,G2:G11)/COUNT(Data)}
Figure 14.6 shows two frequency distributions — one in terms of counts and one in terms of percentages.
The figure also shows a chart (histogram) created from the frequency distribution.
261