
Page 158 - Excel Data Analysis
P. 158
09 537547 Ch08.qxd 3/4/03 12:06 PM Page 144
EXCEL DATA ANALYSIS
CREATE A PIVOTCHART FROM
AN EXTERNAL DATABASE (CONTINUED)
xcel always creates a new chart sheet for each You create the PivotChart report by dragging the
PivotChart that you create. You cannot embed a appropriate fields onto the Data, Categories, Series, and
E PivotChart in a worksheet, as you can with regular Page areas. All the database fields appear on the PivotTable
charts. Although you cannot specify the PivotChart location, Field List box. As you add fields to the PivotChart, Excel
when you use the PivotTable and PivotChart Wizard, you adds the same fields to the associated PivotTable report.
still have to specify a worksheet location for the PivotTable You can use any combination of the available fields, but if
report associated with the PivotChart. You can either place you do not use a field on the layout, the corresponding data
the report in the current worksheet or create a new values do not appear on the PivotChart.
worksheet within the current workbook. If you decide to Fields that you drag into the Category area of the
place the PivotTable report in the current worksheet, you PivotChart become the specific categories for the
must specify the first cell for the report. You should specify corresponding data points. The Category field corresponds
a cell that does not contain data values. If you do so, Excel to the Row field on the PivotTable. Fields that you place in
gives you the option of replacing the current cell values.
the Series area identify the different data series for the
By default, Excel always creates a Stacked Column chart for chart. The Series fields correspond to the Column fields on
the PivotChart. You can change the chart type with the the PivotTable report.
Chart Type dialog box. See the section "Change the Chart
Type of a PivotChart" for more information about changing
the chart type.
CREATE A PIVOTCHART FROM AN EXTERNAL DATABASE (CONTINUED)
=$A$3
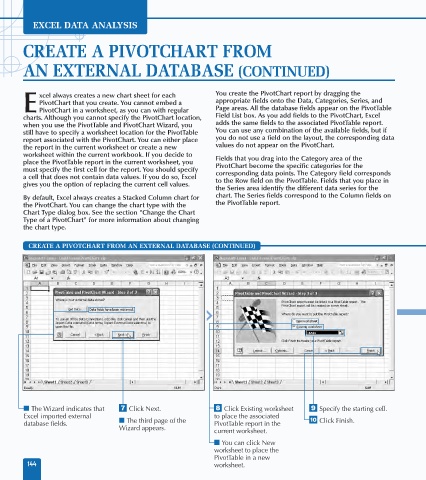
■ The Wizard indicates that ‡ Click Next. ° Click Existing worksheet · Specify the starting cell.
Excel imported external to place the associated
database fields. ■ The third page of the PivotTable report in the ‚ Click Finish.
Wizard appears.
current worksheet.
■ You can click New
worksheet to place the
PivotTable in a new
144 worksheet.