
Page 160 - Excel Data Analysis
P. 160
09 537547 Ch08.qxd 3/4/03 12:06 PM Page 146
EXCEL DATA ANALYSIS
CHANGE THE LAYOUT OF A PIVOTCHART
ou can visually analyze data in a different fashion by You can also move any fields on the PivotTable report from
altering the layout of a PivotChart. If you want to one area to another. When you move a field, the filter
Y change the layout of a PivotChart, you can quickly selections remain the same for the field. For example, if you
drag the fields to different locations. For example, you can are only viewing values for the months of January and
move the fields in the Category area to the Series area or February and you move the Month field to the Series area,
even add additional fields to an area. Keep in mind that those months remain the selections. See the section "Filter
when you change the Category fields, the number of data a PivotChart Field" for more information on filtering fields.
points on the chart changes to reflect the new category. The When you move or add fields on a PivotChart, Excel
Category fields also determine the labels that appear on the identifies the location for the field as you drag it. For
Category axis. On the Stacked Column chart, the category example, if you drag the field to the Categories area and in
axis is the horizontal or X axis.
front of the current fields, Excel inserts the new field to the
You can add new fields using the PivotTable Field List, left of the line. The field listed on the left of the Category
which shows all the fields that were selected when you area becomes the main category.
created the PivotChart. The list displays the currently used
fields in bold. If you add a field to the Categories area, Excel
creates a subcategory for the field on the right.
CHANGE THE LAYOUT OF A PIVOTCHART
CustomerID
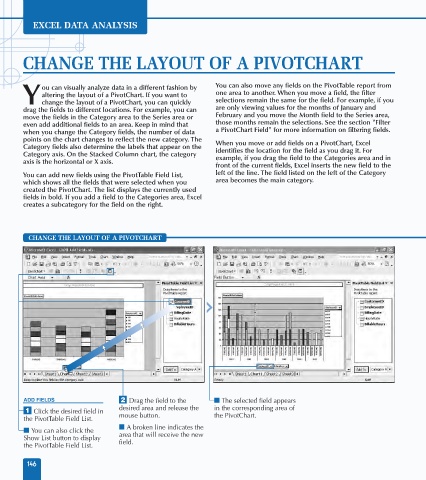
ADD FIELDS ¤ Drag the field to the ■ The selected field appears
desired area and release the in the corresponding area of
⁄ Click the desired field in
the PivotTable Field List. mouse button. the PivotChart.
■ A broken line indicates the
■ You can also click the
Show List button to display area that will receive the new
the PivotTable Field List. field.
146