
Page 247 - Excel Progamming Weekend Crash Course
P. 247
n540629 ch17.qxd 9/2/03 9:35 AM Page 222
222 Saturday Evening
The ChartWizard Method
If you have created charts in Excel, you have probably used the Chart Wizard. Similar to
other Microsoft wizards, this tool walks you though a series of steps, asking questions about
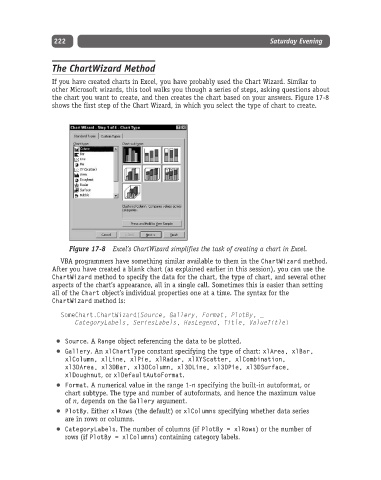
the chart you want to create, and then creates the chart based on your answers. Figure 17-8
shows the first step of the Chart Wizard, in which you select the type of chart to create.
Figure 17-8 Excel’s ChartWizard simplifies the task of creating a chart in Excel.
VBA programmers have something similar available to them in the ChartWizard method.
After you have created a blank chart (as explained earlier in this session), you can use the
ChartWizard method to specify the data for the chart, the type of chart, and several other
aspects of the chart’s appearance, all in a single call. Sometimes this is easier than setting
all of the Chart object’s individual properties one at a time. The syntax for the
ChartWizard method is:
SomeChart.ChartWizard(Source, Gallery, Format, PlotBy, _
CategoryLabels, SeriesLabels, HasLegend, Title, ValueTitle)
Source.A Range object referencing the data to be plotted.
Gallery. An xlChartType constant specifying the type of chart: xlArea, xlBar,
xlColumn, xlLine, xlPie, xlRadar, xlXYScatter, xlCombination,
xl3DArea, xl3DBar, xl3DColumn, xl3DLine, xl3DPie, xl3DSurface,
xlDoughnut, or xlDefaultAutoFormat.
Format. A numerical value in the range 1-n specifying the built-in autoformat, or
chart subtype. The type and number of autoformats, and hence the maximum value
of n, depends on the Gallery argument.
PlotBy. Either xlRows (the default) or xlColumns specifying whether data series
are in rows or columns.
CategoryLabels. The number of columns (if PlotBy = xlRows) or the number of
rows (if PlotBy = xlColumns) containing category labels.