
Page 245 - Excel Progamming Weekend Crash Course
P. 245
n540629 ch17.qxd 9/2/03 9:35 AM Page 220
220 Saturday Evening
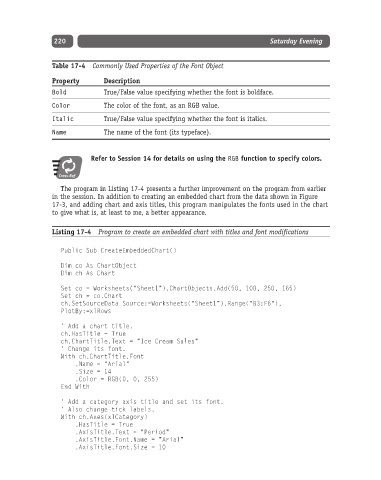
Table 17-4 Commonly Used Properties of the Font Object
Property Description
Bold True/False value specifying whether the font is boldface.
Color The color of the font, as an RGB value.
Italic True/False value specifying whether the font is italics.
Name The name of the font (its typeface).
Refer to Session 14 for details on using the RGB function to specify colors.
Cross-Ref
The program in Listing 17-4 presents a further improvement on the program from earlier
in the session. In addition to creating an embedded chart from the data shown in Figure
17-3, and adding chart and axis titles, this program manipulates the fonts used in the chart
to give what is, at least to me, a better appearance.
Listing 17-4 Program to create an embedded chart with titles and font modifications
Public Sub CreateEmbeddedChart()
Dim co As ChartObject
Dim ch As Chart
Set co = Worksheets(“Sheet1”).ChartObjects.Add(50, 100, 250, 165)
Set ch = co.Chart
ch.SetSourceData Source:=Worksheets(“Sheet1”).Range(“B3:F6”),
PlotBy:=xlRows
‘ Add a chart title.
ch.HasTitle = True
ch.ChartTitle.Text = “Ice Cream Sales”
‘ Change its font.
With ch.ChartTitle.Font
.Name = “Arial”
.Size = 14
.Color = RGB(0, 0, 255)
End With
‘ Add a category axis title and set its font.
‘ Also change tick labels.
With ch.Axes(xlCategory)
.HasTitle = True
.AxisTitle.Text = “Period”
.AxisTitle.Font.Name = “Arial”
.AxisTitle.Font.Size = 10